- Home >
- Stock Photos >
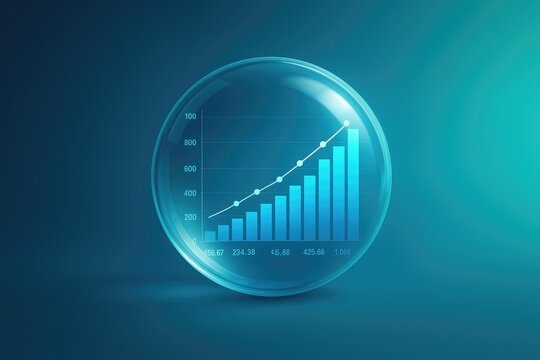
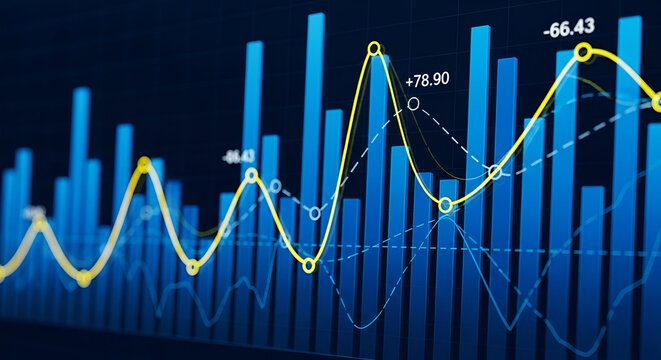
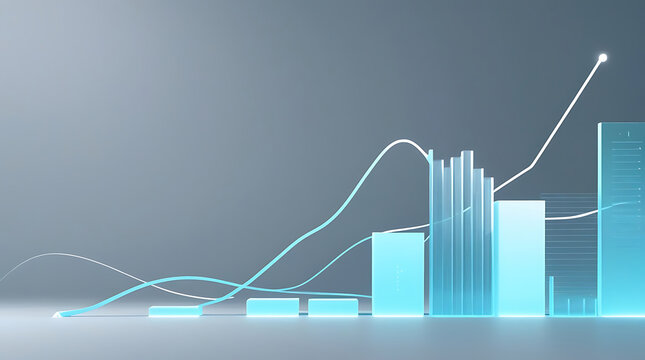
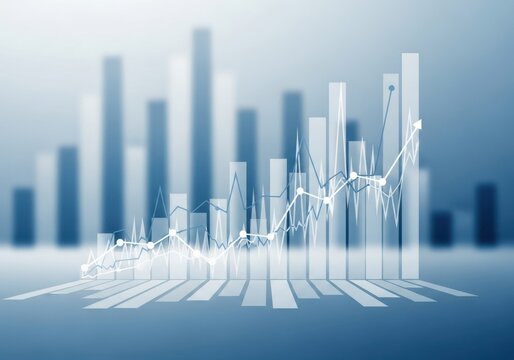
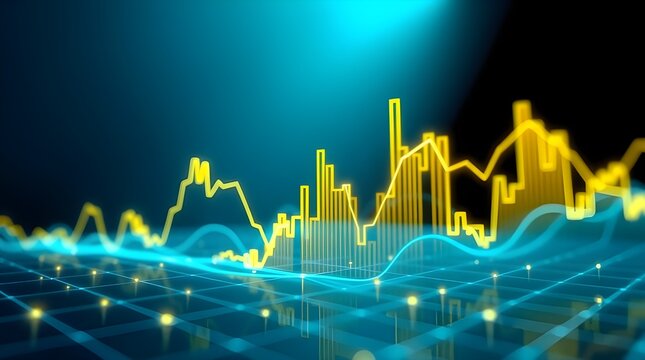
- Financial Data with Trend Lines and Bar Charts
Financial Data with Trend Lines and Bar Charts Image

Dynamic depiction of financial patterns and trends, showcasing various data representations like trend lines and bar charts against a blue backdrop. Useful for blog articles on stock market forecasting, finance presentations, or economic reports to visualize concept of digital analytics and business growth.
Powered by 


2
downloads
downloads
Tags:
More
Credit Photo
If you would like to credit the Photo, here are some ways you can do so
Text Link
photo Link
<span class="text-link">
<span>
<a target="_blank" href=https://pikwizard.com/photo/financial-data-with-trend-lines-and-bar-charts/39f7fdf2f9380c9b8df04568e439ce03/>PikWizard</a>
</span>
</span>
<span class="image-link">
<span
style="margin: 0 0 20px 0; display: inline-block; vertical-align: middle; width: 100%;"
>
<a
target="_blank"
href="https://pikwizard.com/photo/financial-data-with-trend-lines-and-bar-charts/39f7fdf2f9380c9b8df04568e439ce03/"
style="text-decoration: none; font-size: 10px; margin: 0;"
>
<img src="https://pikwizard.com/pw/medium/39f7fdf2f9380c9b8df04568e439ce03.jpg" style="margin: 0; width: 100%;" alt="" />
<p style="font-size: 12px; margin: 0;">PikWizard</p>
</a>
</span>
</span>
Free (free of charge)
Free for personal and commercial use.
Author: People Creations
Similar Free Stock Images

Premium


Premium


Premium


Premium


Premium


Premium


Premium


Premium


Premium


Premium


Premium


Premium


Premium


Premium


Premium


Premium


Premium


Premium


Premium


Premium


Premium


Premium


Premium


Premium