- Home >
- Stock Photos >
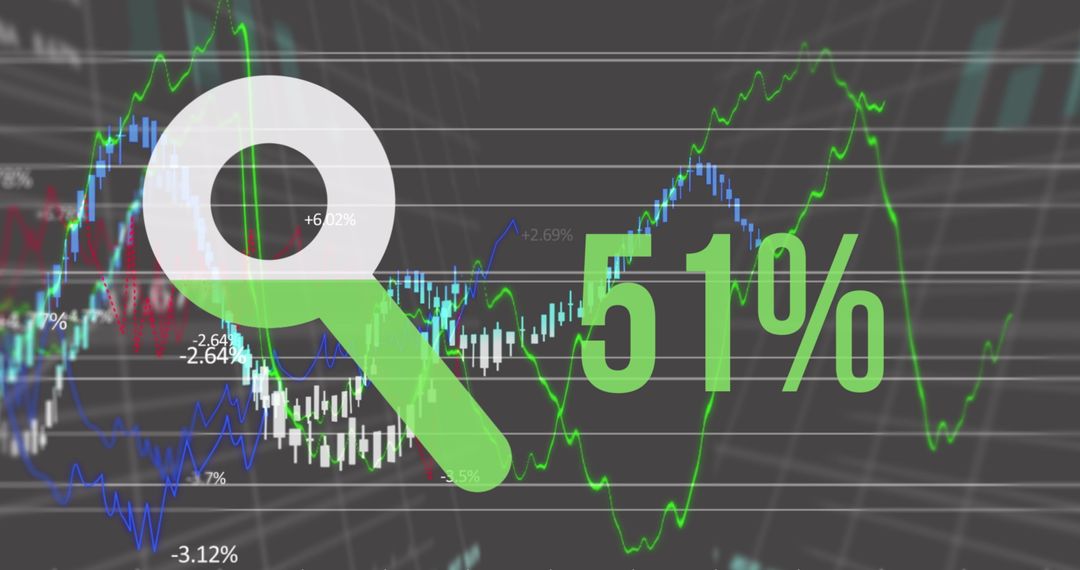
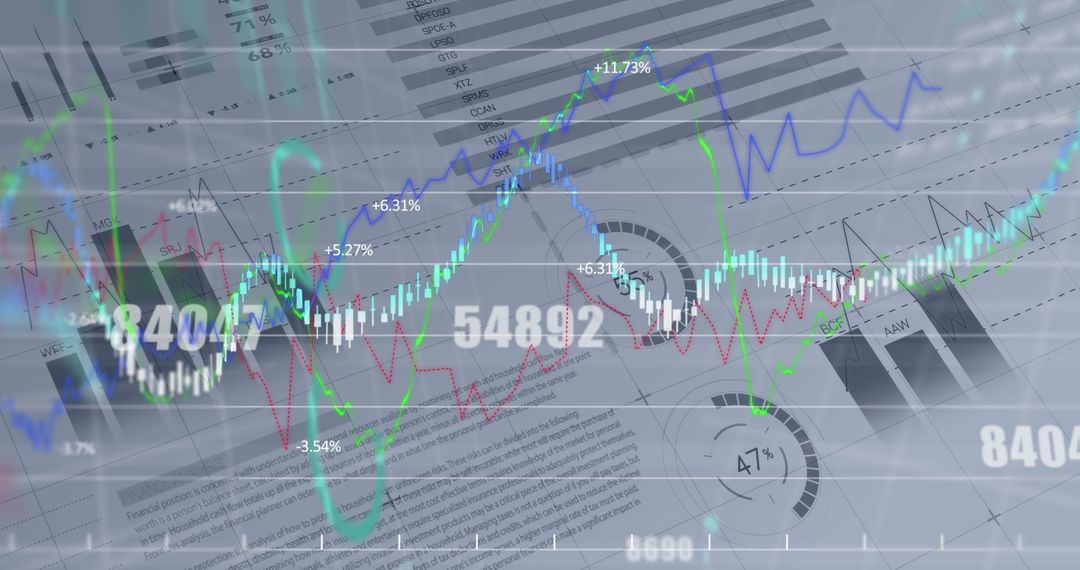
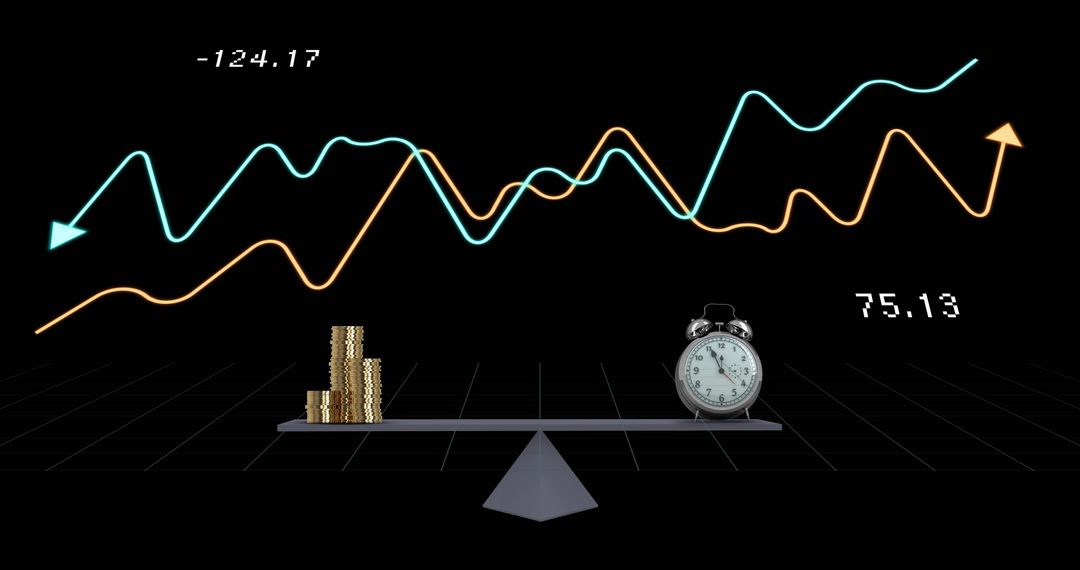
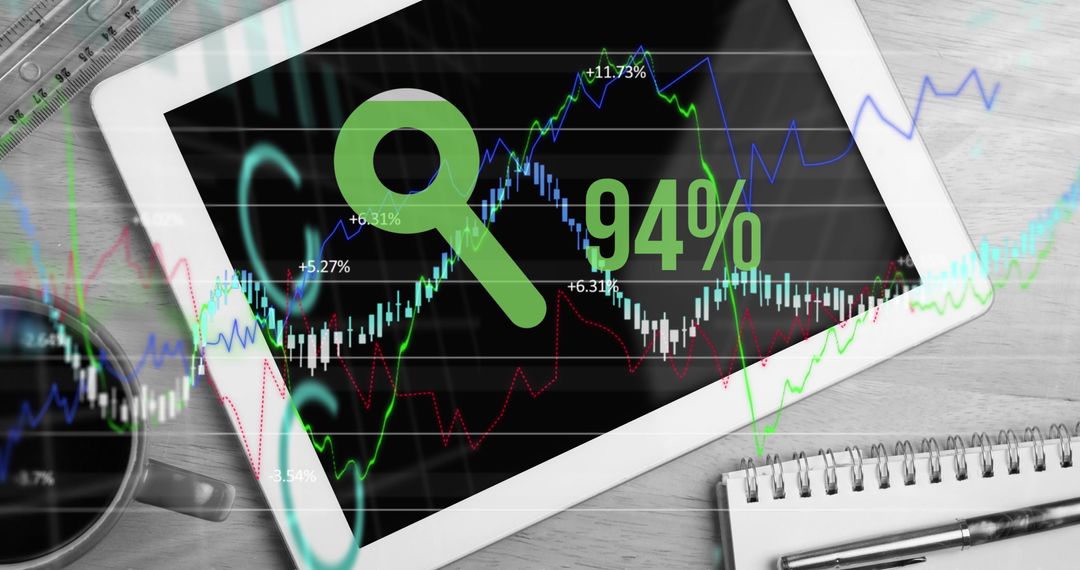
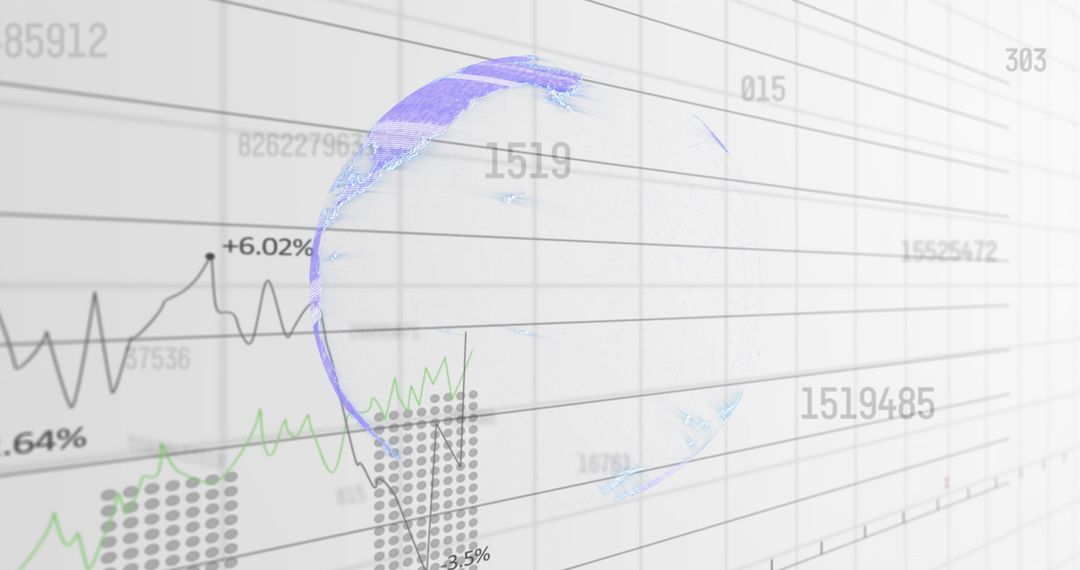
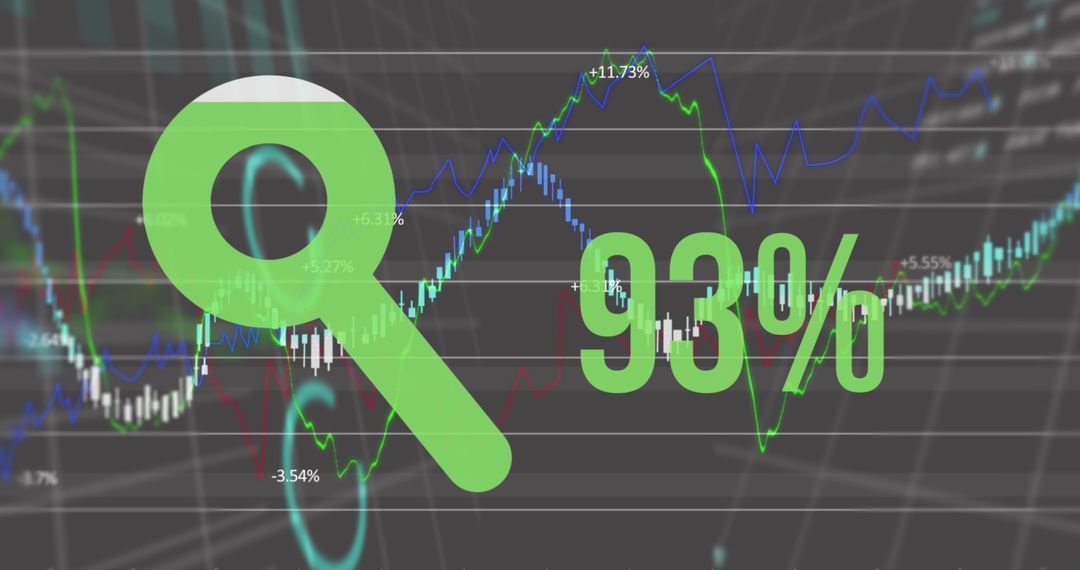
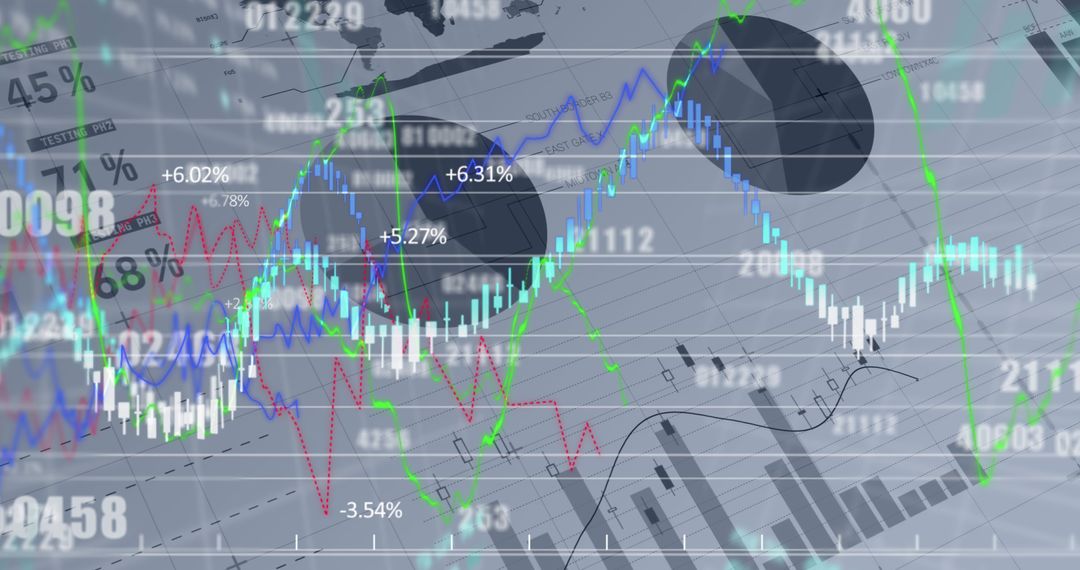
- Financial Datasets with Growth Indicators and Search Symbols
Financial Datasets with Growth Indicators and Search Symbols Image
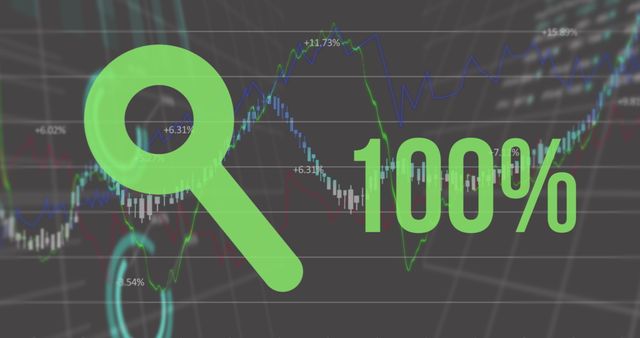
This image depicts analytical representation of financial data, showcasing statistical graphs, growth indicators, and a search symbol suggesting detailed examination. With visuals showing rising percentages and fluctuating statistic lines, this could effectively be used in business report presentations, economic forecasting, market trend illustrations, or for educational resources in finance studies.
Powered by 


2
downloads
downloads
Tags:
More
Credit Photo
If you would like to credit the Photo, here are some ways you can do so
Text Link
photo Link
<span class="text-link">
<span>
<a target="_blank" href=https://pikwizard.com/photo/financial-datasets-with-growth-indicators-and-search-symbols/65dd221da8b04bc1a394b07b44500da3/>PikWizard</a>
</span>
</span>
<span class="image-link">
<span
style="margin: 0 0 20px 0; display: inline-block; vertical-align: middle; width: 100%;"
>
<a
target="_blank"
href="https://pikwizard.com/photo/financial-datasets-with-growth-indicators-and-search-symbols/65dd221da8b04bc1a394b07b44500da3/"
style="text-decoration: none; font-size: 10px; margin: 0;"
>
<img src="https://pikwizard.com/pw/medium/65dd221da8b04bc1a394b07b44500da3.jpg" style="margin: 0; width: 100%;" alt="" />
<p style="font-size: 12px; margin: 0;">PikWizard</p>
</a>
</span>
</span>
Free (free of charge)
Free for personal and commercial use.
Author: People Creations
Similar Free Stock Images

Premium


Premium


Premium


Premium


Premium


Premium


Premium


Premium


Premium


Premium


Premium


Premium


Premium


Premium


Premium


Premium


Premium


Premium


Premium


Premium


Premium


Premium


Premium


Premium