1. Home > 
  2. Stock Photos > 
  3. Financial Decline Against Palestinian Flag Background

Financial Decline Against Palestinian Flag Background Image

Financial Decline Against Palestinian Flag Background

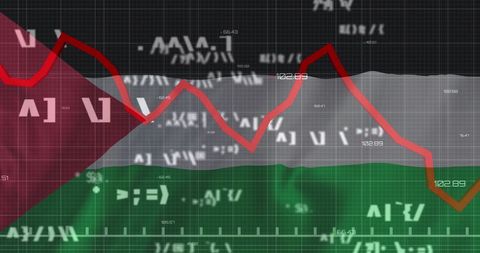
Graphic represents economic downturn with red line chart overlay on Palestinian flag background, symbolizing financial impact amidst geopolitical conflict. Useful for articles on economic impacts of political conflicts, financial market analysis related to Middle East region, or demonstrations of financial decline.

Credit Photo

If you would like to credit the Photo, here are some ways you can do so

Free (free of charge)

Free for personal and commercial use.

Author: Creative Art

Similar Free Stock Images

Rising Green Line on Financial Digital Display
Dynamic Financial Data Analysis Illustration
Financial Market Analysis Overlaying Urban Cityscape
Digital Interface with Financial Data Projections
Futuristic Financial Graphs with Dynamic Green Line
Global Data Visualization Over Evening City Skyline
Statistical Data Processing with Cityscape Overlay
Abstract Financial Graphs Displaying Market Trends
Digital Data Visualization with Dynamic Graph and Global Interface
Digital Financial Data Analytics with Graphs and Codes
Digital Display of Financial Decline Graph and Data Connectivity
Declining Financial Graph Over Data Grid with Global Background
Financial Growth Graph Over Urban Skyline with Currencies
Floating Numbers Over Cityscape Representing Statistical Analysis
Digital Stock Market Data and Financial Charts Algorithm
Economic Downturn in Festive Context with Easter Eggs
Digital Financial Data with Graphs and Numbers Illustrations
Innovative Digital Finance Data Display on Dark Interface
Dynamic Financial Data Chart with Red Trend Line on Green Background
Digital Decline Graphic with QR Code Elements and Red Line
Dynamic Financial Market Graph with Data Points
Dynamic Digital Interface Displaying Financial Data Analysis
Analyzing Global Financial Data with Interactive Technology Panels
Global Economic Trend Representation on Digital World Map
Soccer Competition with Digital Analytics Overlay Merging Sports and Data
Dynamic Graphs Depicting Financial Trends on Purple Grid Background
Financial Market Decline on Digital Screen With Red Line Graph
Financial Data Chart Over City Silhouette
Global Financial Data and Graph Analysis Technology
Digital Financial Data Analytics and Economic Trends
Dynamic Stock Market Data with Fluctuating Graph
Rising Data and Statistics on Global Map in Green Interface Design
Rising Financial Graphs with Digital Data Interface
Digital Financial Interface with Dynamic Graphs and Data Analysis
Financial Data Integration with Agricultural and Environmental Landscapes
Social Media Notifications and Growth Chart Dynamics
Rising Chart Line Over Digital Grid Representing Financial Growth
Abstract Digital Stock Market Trends and Charts Analysis
Digital Growth Hacking with Data Processing Elements
Dynamic Global Data Insights with Trend Lines
Dynamic Red Line Graph on Digital Data Grid Background
Stock Market Showing Declining Trend with Numbers and Graph
Dynamic Financial Data Graph with Global Grid Background
Dynamic Financial Data Graph Visualization on Black Background
Green Line Graph Overlaid on Empty Office with Data Overlay
Financial Data Processing with Graphs and Charts Background
Businessman Analyzing Trends with Futuristic Data Interface
Green Line Chart on Digital Grid with Financial Data Points
Dynamic Financial Chart with Rising Bars and Trend Lines
Economic Downturn Concept on Trading Dashboard with Data Visualization
Dynamic Financial Data with Red Line on Digital Interface
Digital Interface Concept with Data Processing on Servers
Mathematical Formulas and Red Line Graph in Foggy Background
Digital Security Illustration with Graph and Binary Codes
Digital Data Footprint with 6G Network Technology Concept
Dynamic Stock Market Data Display in Red and Green Ticker
Graph Overlay on Business Meeting, Data Analysis Concept
Cryptocurrency Growth Chart Over Digital World Map
Financial Data Growth Over Urban Cityscape with Graph Overlay
Data Analysis and Cybersecurity Concept Art
Digital Data Visualization with Global Analytics Interface
Digital Security and Economic Networking Data Concept
Fluctuating Financial Stock Market with Digital Display
Dynamic Chart Displaying Fluctuating Financial Data Trends
Dynamic Graph and Data Visualizing Trends
Declining Financial Chart Displayed Over Urban Cityscape
Vibrant Financial Data Analysis with Global Currency
Colorful Financial Graphs on Digital Grid Background
Digital Fintech Visualization with Graphs and Data Icons
Abstract Data Visualization with Graphs over Digital Grid Background
Digital Interface with Currency Symbols and Data Analytics
Dynamic Green Financial Graph with Business Icons
Falling Trend Line on Data Dashboard Background with Interactive Elements
Digital Dashboard Analytics Graphic Illustrating Trends
Global Financial Decline and Data Visualization
Dynamic Financial Graph with Changeable Metrics Over Green Line
Red Graph Line Overlaying Cityscape Represents Market Trends
Illustrated Europe Map with Data Insights for Political Analysis
Malware Alert on Digital Interface with Glitch Effects
Data Processing and Analytics Over Cityscape at Night
Global Data Trends Analysis with Networking Interfaces
Dynamic Financial Data Visualization Chart with Trending Lines
Stock Market Analysis Over Jordan Flag
Data Visualization Overlay with Business Analytics Elements
Financial Data Visualization with Green Graph Line on Blue Background
Global Network Analysis with Dynamic Digital Data
Digital Data Analysis with Moving Shapes and Numbers
Financial Chart with Dynamic Numbers on Grid Background
Stock Market Decline Display with Falling Red Graph Line
Abstract Financial Data with Floating Numbers and Patterns
Red Line Graph Overlay on Cityscape Represents Economic Trends
Green Financial Data Chart with Technological Overlay
Digital Interface with Overlapping Code and Graph
Stock Market Decline Data Analysis on Dark Grid Background
Global Financial Data and Social Media Escalation Chart
Digital Stock Market Data with Upward Trend Graph
Eye Chart with Digital Data Integration Visualizing Business Trends
Businesswoman with Suitcase Walking Viewed Through Financial Analytics
Futuristic Data Analytics with Wireframe Head and Digital Features
Futuristic 3D Green Line Chart Showing Financial Growth on Purple Grid Dashboard