- Home >
- Stock Photos >
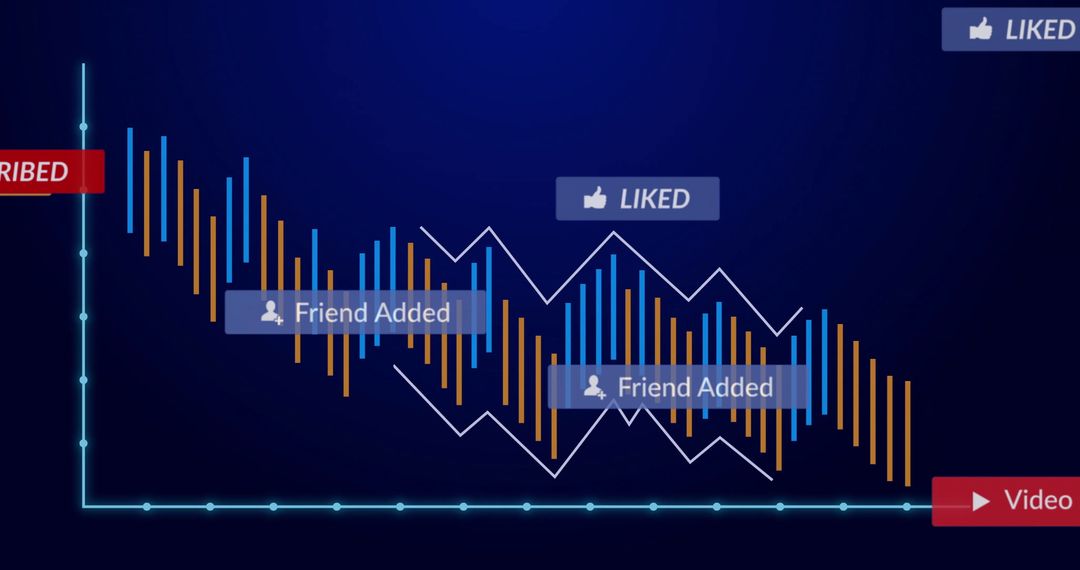
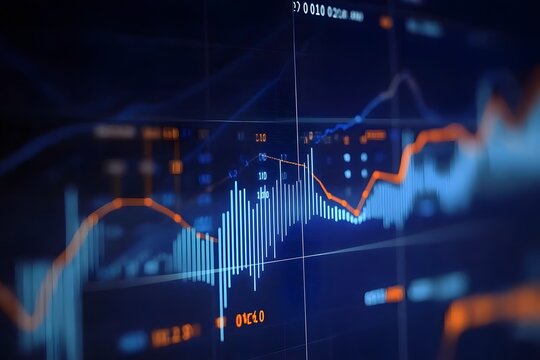
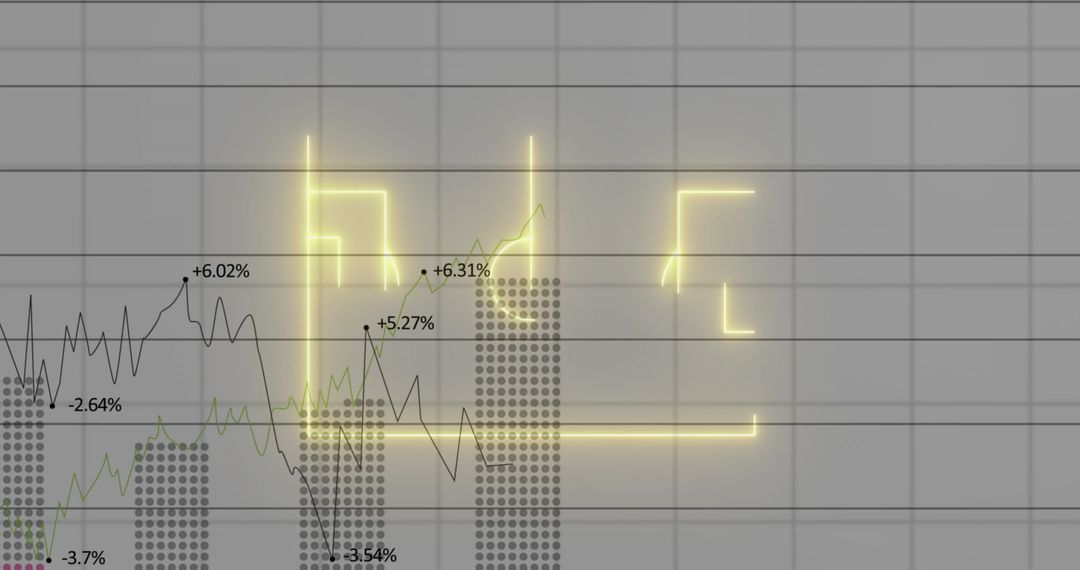
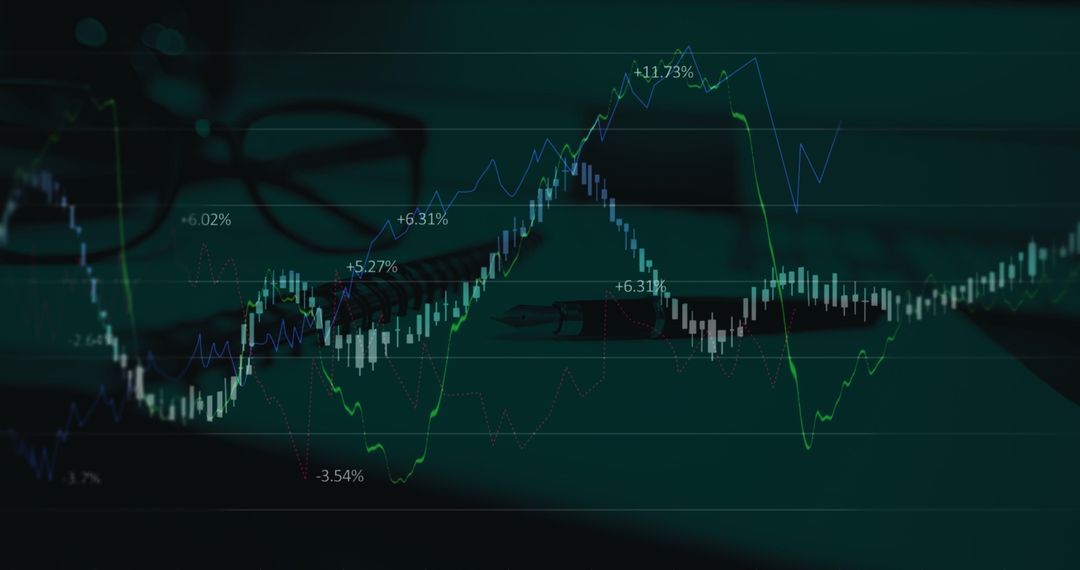
- Financial Digital Dashboard Displaying Market Trends and Data Analysis
Financial Digital Dashboard Displaying Market Trends and Data Analysis Image

This image illustrates a neon-themed financial dashboard with a prominent chart displaying declining trends and key percentages. Ideal for use in publications about financial analysis, economic data visualization, or stock market exhibitions. Useful for presentations focusing on digital finance concepts and illustrating market trends with visually engaging neon elements.
Powered by 


0
downloads
downloads
Tags:
More
Credit Photo
If you would like to credit the Photo, here are some ways you can do so
Text Link
photo Link
<span class="text-link">
<span>
<a target="_blank" href=https://pikwizard.com/photo/financial-digital-dashboard-displaying-market-trends-and-data-analysis/bbd31d7ffe7c32ea3b3896c40a383dd7/>PikWizard</a>
</span>
</span>
<span class="image-link">
<span
style="margin: 0 0 20px 0; display: inline-block; vertical-align: middle; width: 100%;"
>
<a
target="_blank"
href="https://pikwizard.com/photo/financial-digital-dashboard-displaying-market-trends-and-data-analysis/bbd31d7ffe7c32ea3b3896c40a383dd7/"
style="text-decoration: none; font-size: 10px; margin: 0;"
>
<img src="https://pikwizard.com/pw/medium/bbd31d7ffe7c32ea3b3896c40a383dd7.jpg" style="margin: 0; width: 100%;" alt="" />
<p style="font-size: 12px; margin: 0;">PikWizard</p>
</a>
</span>
</span>
Free (free of charge)
Free for personal and commercial use.
Author: Authentic Images
Similar Free Stock Images

Premium


Premium


Premium


Premium


Premium


Premium


Premium


Premium


Premium


Premium


Premium


Premium


Premium


Premium


Premium


Premium


Premium


Premium


Premium


Premium


Premium


Premium


Premium


Premium