- Home >
- Stock Photos >
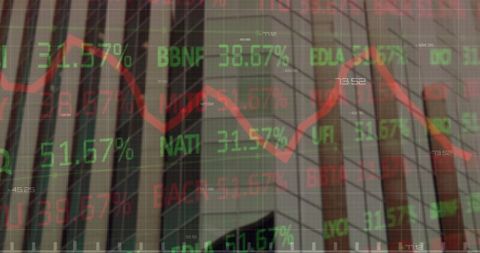
- Financial District with Market Trends Overlay and Analytics Graphics
Financial District with Market Trends Overlay and Analytics Graphics Image

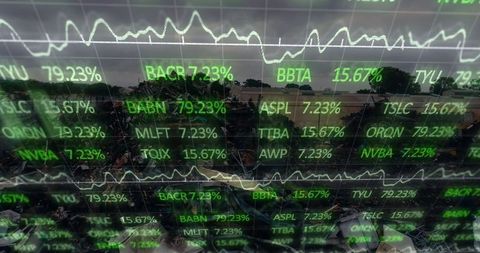
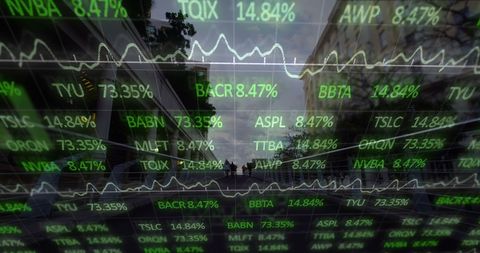
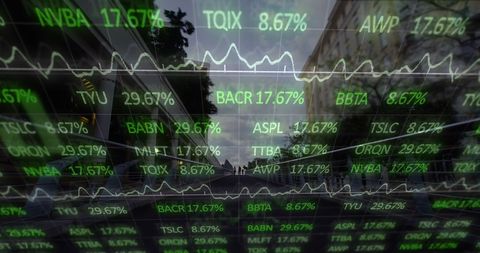
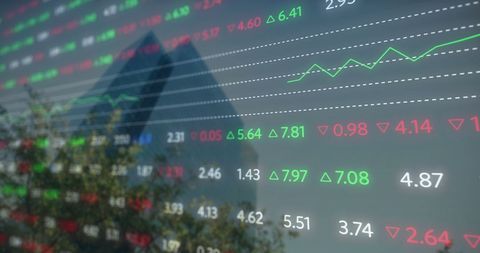
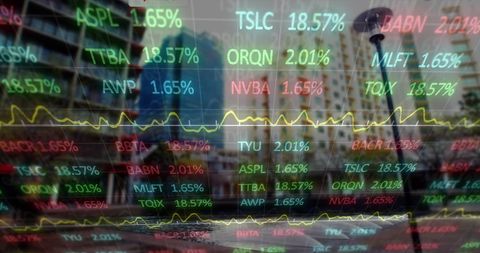
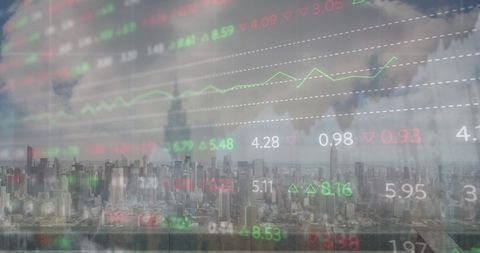
Image showcases a finance district skyline with an overlay of market ticker numbers and a fluctuating graph in green, symbolizing market trends and financial analysis. This visual is ideal for use in articles about stock market reviews, financial predictions, investment strategies, or technological impacts on finance. It also fits well in presentations focused on data analytics in business and finance.
Powered by  - Get 15% off with code: PIKWIZARD15


0
downloads
downloads
Tags:
More
Credit Photo
If you would like to credit the Photo, here are some ways you can do so
Text Link
photo Link
<span class="text-link">
<span>
<a target="_blank" href=https://pikwizard.com/photo/financial-district-with-market-trends-overlay-and-analytics-graphics/ccb2a54b12eb3e9890ceba73c5610861/>PikWizard</a>
</span>
</span>
<span class="image-link">
<span
style="margin: 0 0 20px 0; display: inline-block; vertical-align: middle; width: 100%;"
>
<a
target="_blank"
href="https://pikwizard.com/photo/financial-district-with-market-trends-overlay-and-analytics-graphics/ccb2a54b12eb3e9890ceba73c5610861/"
style="text-decoration: none; font-size: 10px; margin: 0;"
>
<img src="https://pikwizard.com/pw/medium/ccb2a54b12eb3e9890ceba73c5610861.jpg" style="margin: 0; width: 100%;" alt="" />
<p style="font-size: 12px; margin: 0;">PikWizard</p>
</a>
</span>
</span>
Free (free of charge)
Free for personal and commercial use.
Author: Creative Art
Similar Free Stock Images

Premium


Premium


Premium


Premium


Premium


Premium


Premium


Premium


Premium


Premium


Premium


Premium


Premium


Premium


Premium


Premium


Premium


Premium


Premium


Premium


Premium


Premium


Premium


Premium


Premium