
- Home >
- Stock Photos >
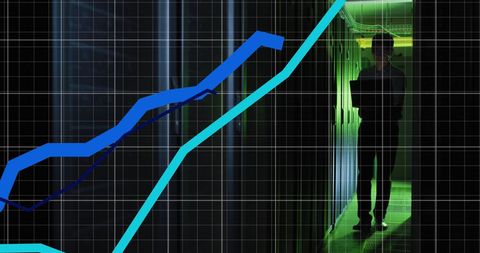
- Financial Downtrend and Data Analysis Concept
Financial Downtrend and Data Analysis Concept Image

Graph illustrating financial downtrend and data analytics visualization. Suitable for conveying market analysis, economic decline, or illustrating business prediction models. Useful for presentations, articles about financial outcomes, or educational materials related to economics and data studies.
Powered by  - Get 15% off with code: PIKWIZARD15


downloads
Tags:
More
Credit Photo
If you would like to credit the Photo, here are some ways you can do so
Text Link
photo Link
<span class="text-link">
<span>
<a target="_blank" href=https://pikwizard.com/photo/financial-downtrend-and-data-analysis-concept/9fb5774d425a6850abccdb008e052a12/>PikWizard</a>
</span>
</span>
<span class="image-link">
<span
style="margin: 0 0 20px 0; display: inline-block; vertical-align: middle; width: 100%;"
>
<a
target="_blank"
href="https://pikwizard.com/photo/financial-downtrend-and-data-analysis-concept/9fb5774d425a6850abccdb008e052a12/"
style="text-decoration: none; font-size: 10px; margin: 0;"
>
<img src="https://pikwizard.com/pw/medium/9fb5774d425a6850abccdb008e052a12.jpg" style="margin: 0; width: 100%;" alt="" />
<p style="font-size: 12px; margin: 0;">PikWizard</p>
</a>
</span>
</span>
Free (free of charge)
Free for personal and commercial use.
Author: Authentic Images
Similar Free Stock Images
Loading...

Premium


Premium


Premium

Premium


Premium


Premium


Premium


Premium


Premium


Premium

Premium


Premium


Premium


Premium


Premium


Premium


Premium


Premium


Premium


Premium


Premium


Premium


Premium

Premium


Premium


Explore More Free Stock Images