- Home >
- Stock Photos >
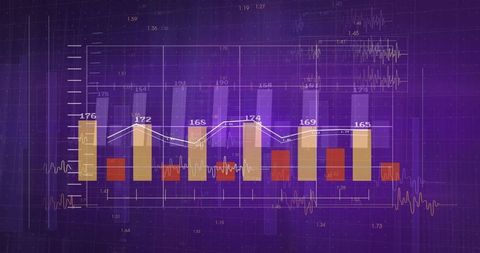
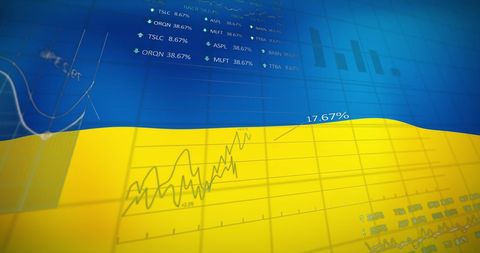
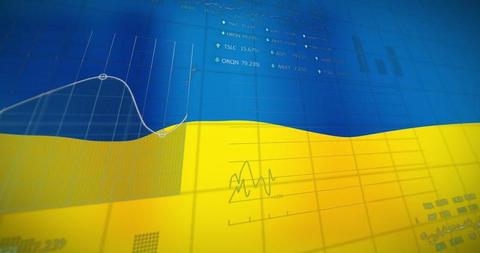
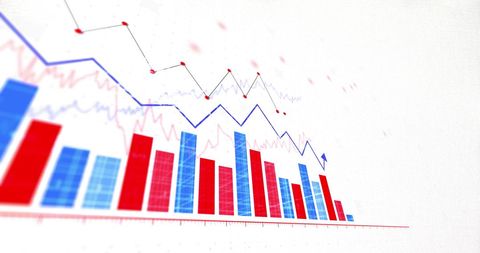
- Financial Graph Data Overlay Ukraine Flag Concept
Financial Graph Data Overlay Ukraine Flag Concept Image

This visual incorporates financial data representations such as graphs and charts overlaid with the colors of the Ukraine flag, symbolizing the economic and political challenges faced by the country. Useful for digital media, articles on economic impacts, international relations analysis, and discussions regarding financial or political stability centered on Ukraine.

downloads
Tags:
More
Credit Photo
If you would like to credit the Photo, here are some ways you can do so
Text Link
photo Link
<span class="text-link">
<span>
<a target="_blank" href=https://pikwizard.com/photo/financial-graph-data-overlay-ukraine-flag-concept/bebd2f7f6945ba0f14e6ad2c4c6156e7/>PikWizard</a>
</span>
</span>
<span class="image-link">
<span
style="margin: 0 0 20px 0; display: inline-block; vertical-align: middle; width: 100%;"
>
<a
target="_blank"
href="https://pikwizard.com/photo/financial-graph-data-overlay-ukraine-flag-concept/bebd2f7f6945ba0f14e6ad2c4c6156e7/"
style="text-decoration: none; font-size: 10px; margin: 0;"
>
<img src="https://pikwizard.com/pw/medium/bebd2f7f6945ba0f14e6ad2c4c6156e7.jpg" style="margin: 0; width: 100%;" alt="" />
<p style="font-size: 12px; margin: 0;">PikWizard</p>
</a>
</span>
</span>
Free (free of charge)
Free for personal and commercial use.
Author: Authentic Images