- Home >
- Stock Photos >
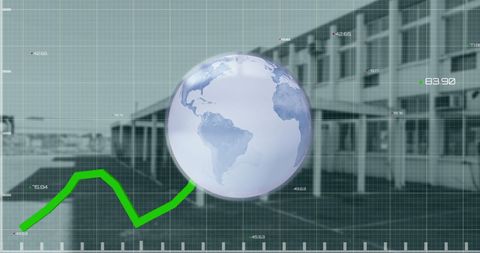
- Financial Graph on Globe with Digital Grid Background
Financial Graph on Globe with Digital Grid Background Image

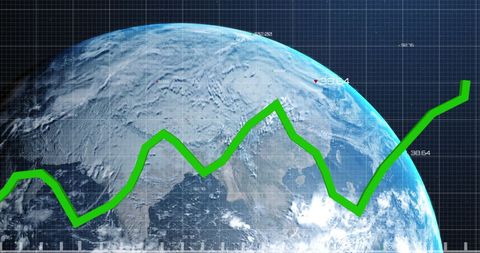
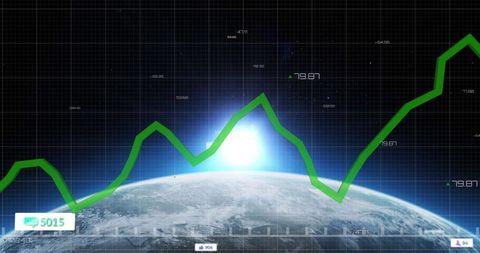
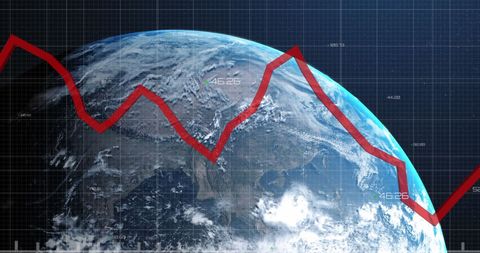
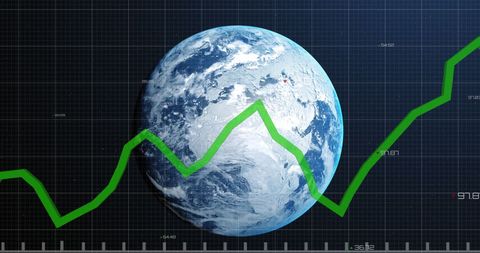
Visualization of a financial graph overlaying a globe with a digital grid background conveys global economic data and trends. Useful for finance technology, global market analysis, international business presentations, and showcasing digital innovation.

downloads
Tags:
More
Credit Photo
If you would like to credit the Photo, here are some ways you can do so
Text Link
photo Link
<span class="text-link">
<span>
<a target="_blank" href=https://pikwizard.com/photo/financial-graph-on-globe-with-digital-grid-background/5e320a152cd76db7f2b9dd02b50e9456/>PikWizard</a>
</span>
</span>
<span class="image-link">
<span
style="margin: 0 0 20px 0; display: inline-block; vertical-align: middle; width: 100%;"
>
<a
target="_blank"
href="https://pikwizard.com/photo/financial-graph-on-globe-with-digital-grid-background/5e320a152cd76db7f2b9dd02b50e9456/"
style="text-decoration: none; font-size: 10px; margin: 0;"
>
<img src="https://pikwizard.com/pw/medium/5e320a152cd76db7f2b9dd02b50e9456.jpg" style="margin: 0; width: 100%;" alt="" />
<p style="font-size: 12px; margin: 0;">PikWizard</p>
</a>
</span>
</span>
Free (free of charge)
Free for personal and commercial use.
Author: Creative Art