
- Home >
- Stock Photos >
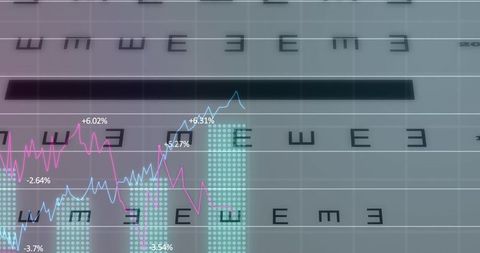
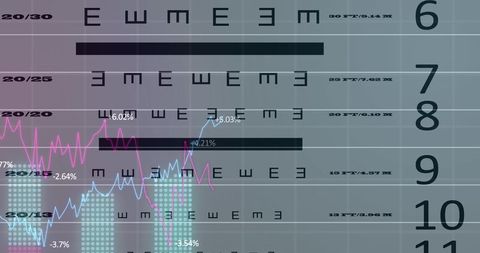
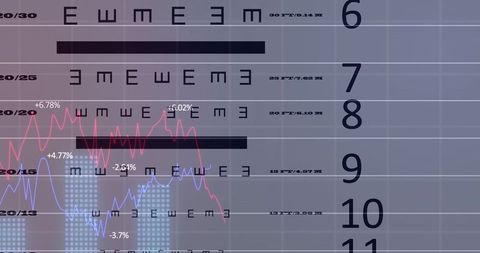
- Financial Graph over Letter Chart Indicating Data Analysis
Financial Graph over Letter Chart Indicating Data Analysis Image

This visually engaging image combines elements of a letter chart with overlaid data graphs and percentages, symbolizing economic statistics and financial analysis. Bright lines rising and falling against the chart suggest a focus on data trends, decision making, and analytic strategy. This image could be valuable for business presentations, financial services resources, or any context that deals with interpretation of similative and comparative market data.
Powered by  - Get 15% off with code: PIKWIZARD15


downloads
Tags:
More
Credit Photo
If you would like to credit the Photo, here are some ways you can do so
Text Link
photo Link
<span class="text-link">
<span>
<a target="_blank" href=https://pikwizard.com/photo/financial-graph-over-letter-chart-indicating-data-analysis/83184b921c76d2df2b51ab65d66c8b46/>PikWizard</a>
</span>
</span>
<span class="image-link">
<span
style="margin: 0 0 20px 0; display: inline-block; vertical-align: middle; width: 100%;"
>
<a
target="_blank"
href="https://pikwizard.com/photo/financial-graph-over-letter-chart-indicating-data-analysis/83184b921c76d2df2b51ab65d66c8b46/"
style="text-decoration: none; font-size: 10px; margin: 0;"
>
<img src="https://pikwizard.com/pw/medium/83184b921c76d2df2b51ab65d66c8b46.jpg" style="margin: 0; width: 100%;" alt="" />
<p style="font-size: 12px; margin: 0;">PikWizard</p>
</a>
</span>
</span>
Free (free of charge)
Free for personal and commercial use.
Author: Authentic Images
Similar Free Stock Images

Premium


Premium

Premium


Premium

Premium

Premium


Premium


Premium


Premium


Premium


Premium


Premium


Premium


Premium

Premium


Premium

Premium

Premium


Premium

Premium


Premium


Premium

Premium


Premium


Premium


Explore More Free Stock Images