- Home >
- Stock Photos >
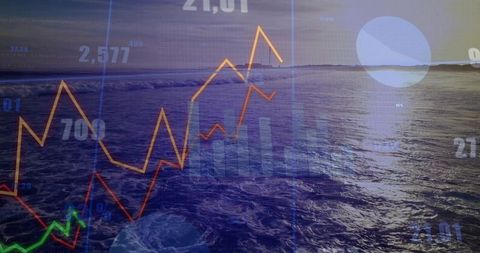
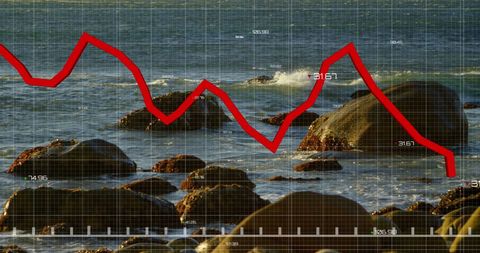
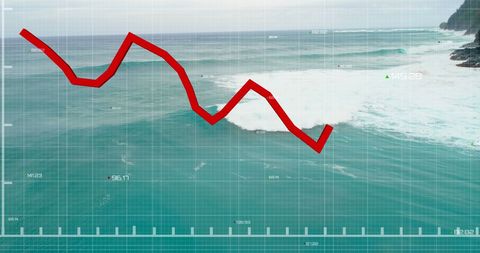
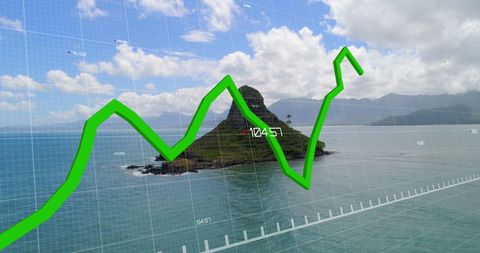
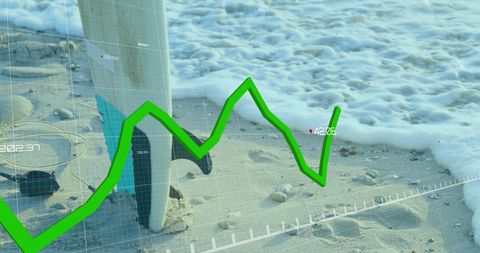
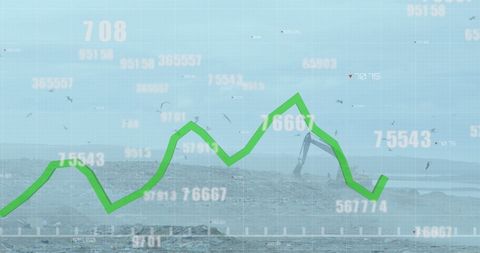
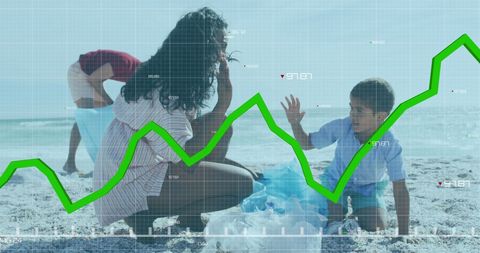
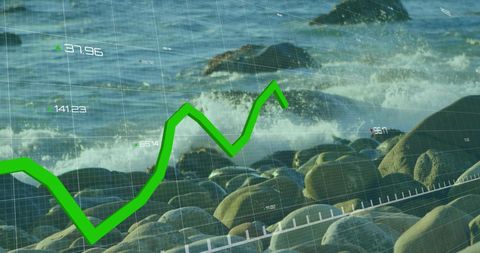
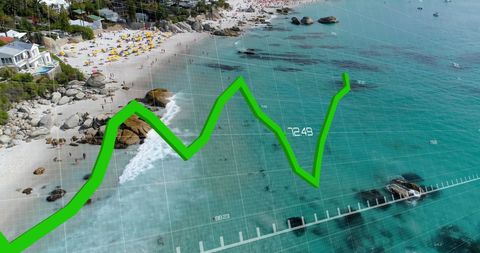
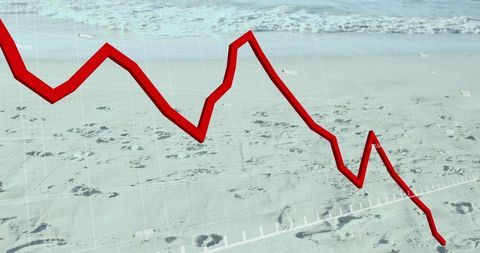
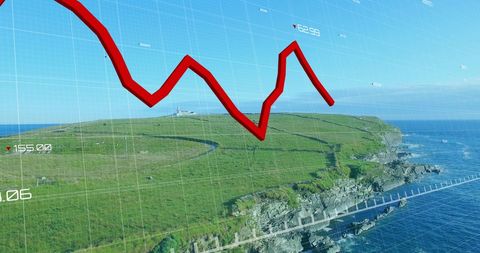
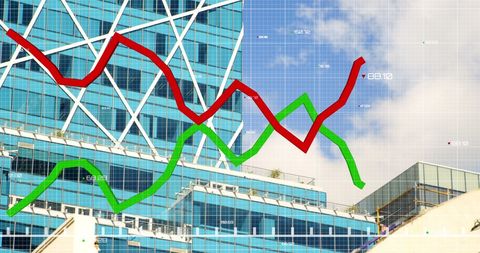
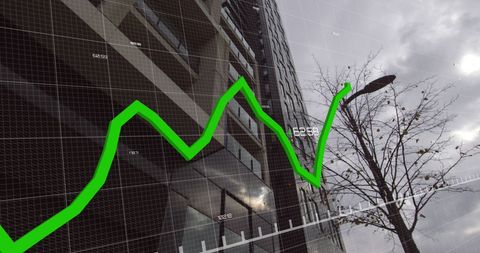
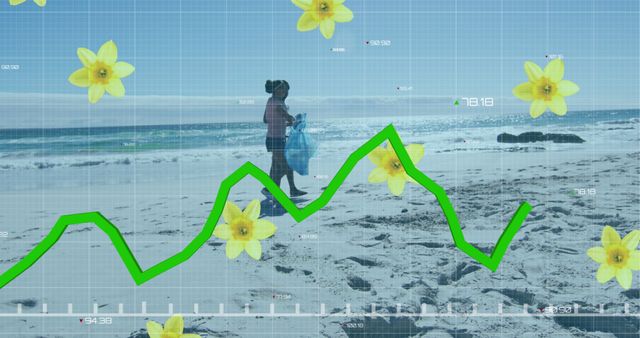
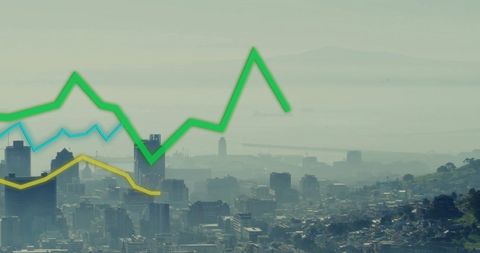
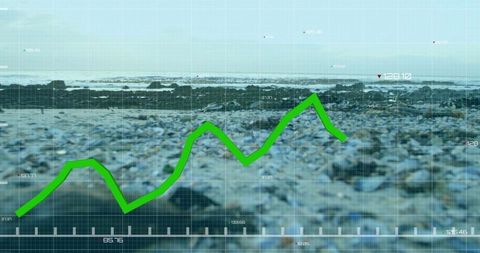
- Financial Graph Overlaid on Seascape Symbolizing Market Analysis
Financial Graph Overlaid on Seascape Symbolizing Market Analysis Image
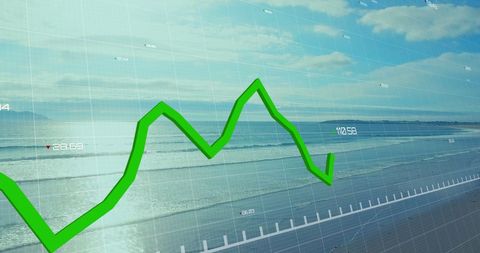
A dynamic green financial line graph juxtaposed against a serene seascape, illustrating the intersection of economic trends and natural beauty. Ideal for use in articles about market analysis, financial forecasting, or combining nature with technological developments in global finance. Suitable for presentations related to financial planning and investment strategies.
Powered by 


0
downloads
downloads
Tags:
More
Credit Photo
If you would like to credit the Photo, here are some ways you can do so
Text Link
photo Link
<span class="text-link">
<span>
<a target="_blank" href=https://pikwizard.com/photo/financial-graph-overlaid-on-seascape-symbolizing-market-analysis/58841a4fe4c96c1609851bf64f11de3a/>PikWizard</a>
</span>
</span>
<span class="image-link">
<span
style="margin: 0 0 20px 0; display: inline-block; vertical-align: middle; width: 100%;"
>
<a
target="_blank"
href="https://pikwizard.com/photo/financial-graph-overlaid-on-seascape-symbolizing-market-analysis/58841a4fe4c96c1609851bf64f11de3a/"
style="text-decoration: none; font-size: 10px; margin: 0;"
>
<img src="https://pikwizard.com/pw/medium/58841a4fe4c96c1609851bf64f11de3a.jpg" style="margin: 0; width: 100%;" alt="" />
<p style="font-size: 12px; margin: 0;">PikWizard</p>
</a>
</span>
</span>
Free (free of charge)
Free for personal and commercial use.
Author: People Creations
Similar Free Stock Images

Premium


Premium


Premium


Premium


Premium


Premium


Premium


Premium


Premium


Premium


Premium


Premium


Premium


Premium


Premium


Premium


Premium


Premium


Premium


Premium


Premium


Premium


Premium


Premium


Premium