
- Home >
- Stock Photos >
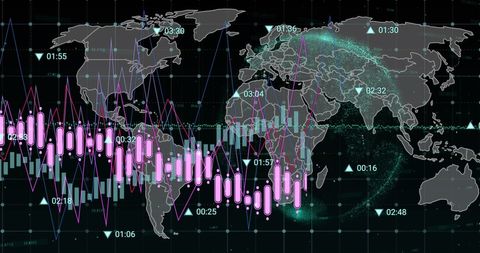
- Financial Graph Overlay on Global Digital Interface
Financial Graph Overlay on Global Digital Interface Image

Green and purple data processing graph overlay on digital globe signifies global economic fluctuations. Ideal for use in financial articles, stock market analysis, data-driven presentations, and technology-themed websites or publications. Appeals to those interested in digital finance and modern technology interfaces.
Powered by  - Get 15% off with code: PIKWIZARD15


downloads
Tags:
More
Credit Photo
If you would like to credit the Photo, here are some ways you can do so
Text Link
photo Link
<span class="text-link">
<span>
<a target="_blank" href=https://pikwizard.com/photo/financial-graph-overlay-on-global-digital-interface/7c268df32b1a200b2c046df85388d0bd/>PikWizard</a>
</span>
</span>
<span class="image-link">
<span
style="margin: 0 0 20px 0; display: inline-block; vertical-align: middle; width: 100%;"
>
<a
target="_blank"
href="https://pikwizard.com/photo/financial-graph-overlay-on-global-digital-interface/7c268df32b1a200b2c046df85388d0bd/"
style="text-decoration: none; font-size: 10px; margin: 0;"
>
<img src="https://pikwizard.com/pw/medium/7c268df32b1a200b2c046df85388d0bd.jpg" style="margin: 0; width: 100%;" alt="" />
<p style="font-size: 12px; margin: 0;">PikWizard</p>
</a>
</span>
</span>
Free (free of charge)
Free for personal and commercial use.
Author: People Creations
Similar Free Stock Images

Premium


Premium


Premium


Premium


Premium


Premium


Premium


Premium


Premium


Premium


Premium


Premium


Premium


Premium


Premium


Premium


Premium


Premium


Premium


Premium


Premium


Premium

Premium

Premium


Premium


Explore More Free Stock Images