- Home >
- Stock Photos >
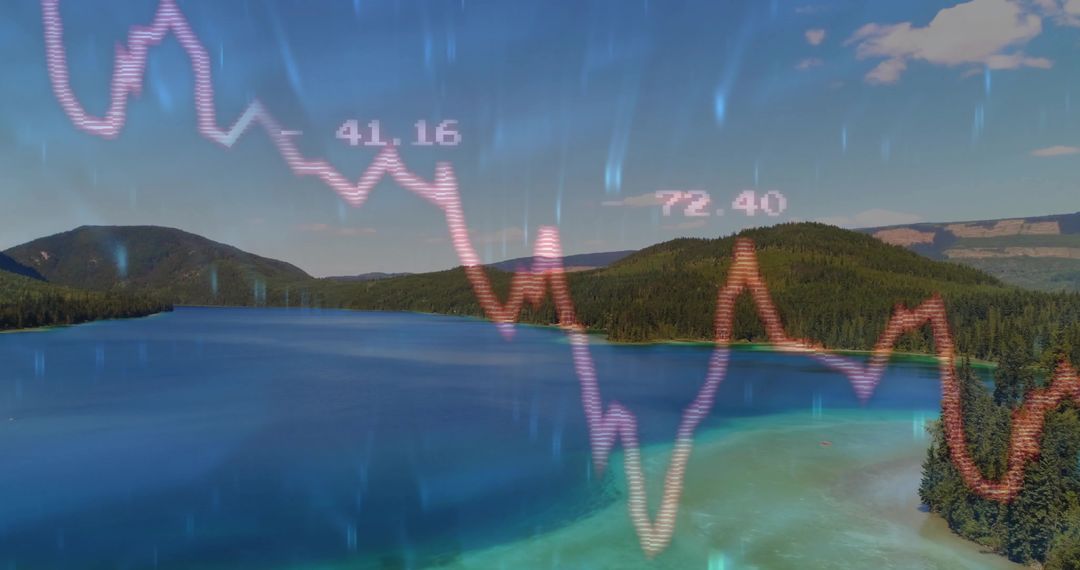
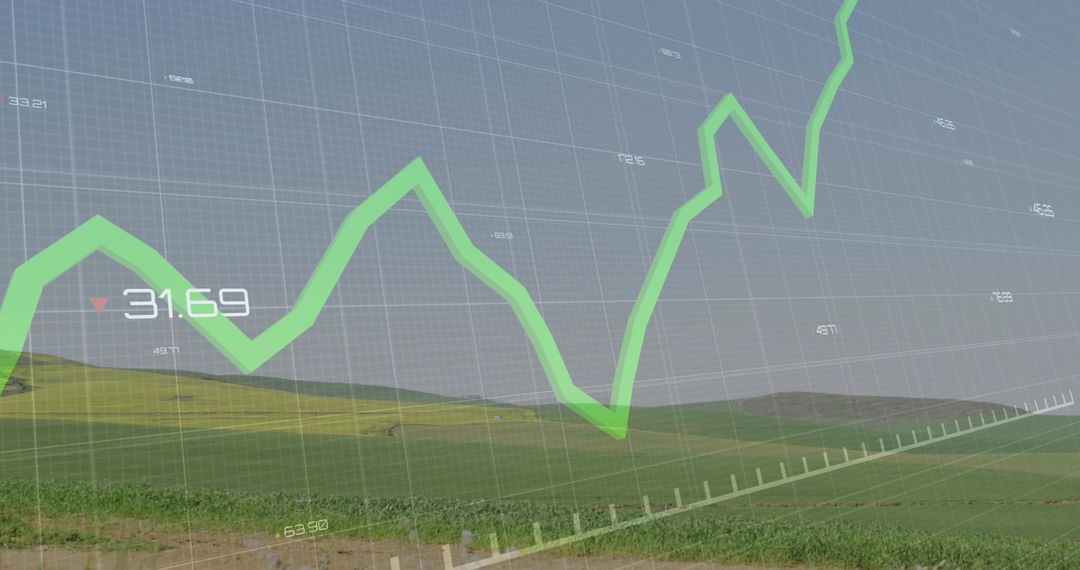
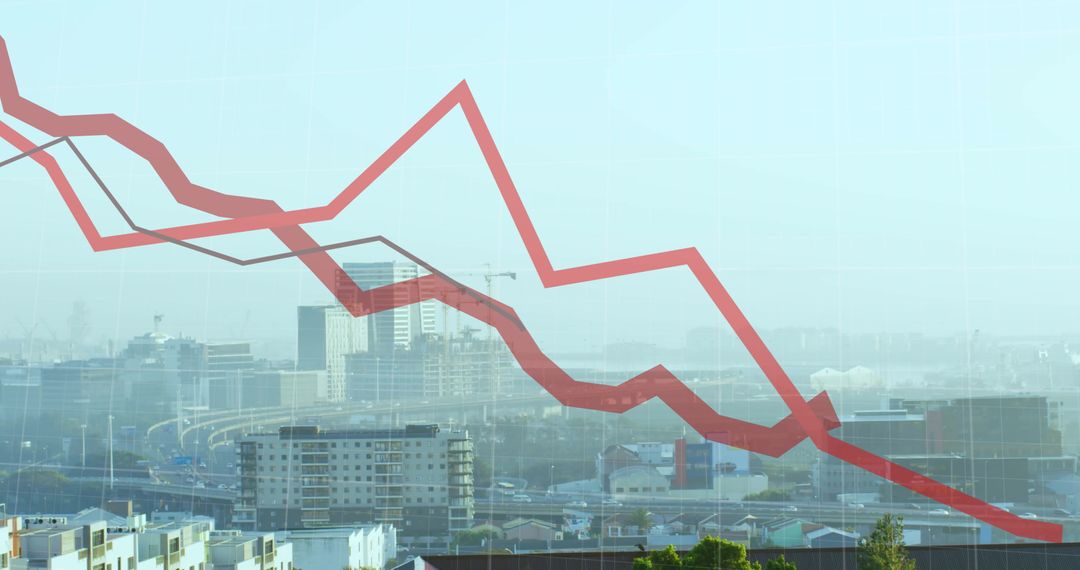
- Financial Graph Overlay on Scenic Landscape
Financial Graph Overlay on Scenic Landscape Image
A vivid red financial graph overlays a lush coastal landscape, symbolizing the intersection between natural beauty and global finance. The graph suggests insights into rising and falling economic trends. Perfect for illustrating themes of economic impact on environments, technological advancements in business, or global data analysis, this concept triggers thought about sustainable practices interfacing with modern financial systems.
Powered by 


2
downloads
downloads
Tags:
More
Credit Photo
If you would like to credit the Photo, here are some ways you can do so
Text Link
photo Link
<span class="text-link">
<span>
<a target="_blank" href=https://pikwizard.com/photo/financial-graph-overlay-on-scenic-landscape/725f8b1731fbd9ccb2bd69cb11954248/>PikWizard</a>
</span>
</span>
<span class="image-link">
<span
style="margin: 0 0 20px 0; display: inline-block; vertical-align: middle; width: 100%;"
>
<a
target="_blank"
href="https://pikwizard.com/photo/financial-graph-overlay-on-scenic-landscape/725f8b1731fbd9ccb2bd69cb11954248/"
style="text-decoration: none; font-size: 10px; margin: 0;"
>
<img src="https://pikwizard.com/pw/medium/725f8b1731fbd9ccb2bd69cb11954248.jpg" style="margin: 0; width: 100%;" alt="" />
<p style="font-size: 12px; margin: 0;">PikWizard</p>
</a>
</span>
</span>
Free (free of charge)
Free for personal and commercial use.
Author: Creative Art
Similar Free Stock Images

Premium


Premium


Premium


Premium


Premium


Premium


Premium


Premium


Premium


Premium


Premium


Premium


Premium


Premium


Premium


Premium


Premium


Premium


Premium


Premium


Premium


Premium


Premium


Premium