1. Home > 
  2. Stock Photos > 
  3. Financial Graph Overlays Modern Architecture Backdrop

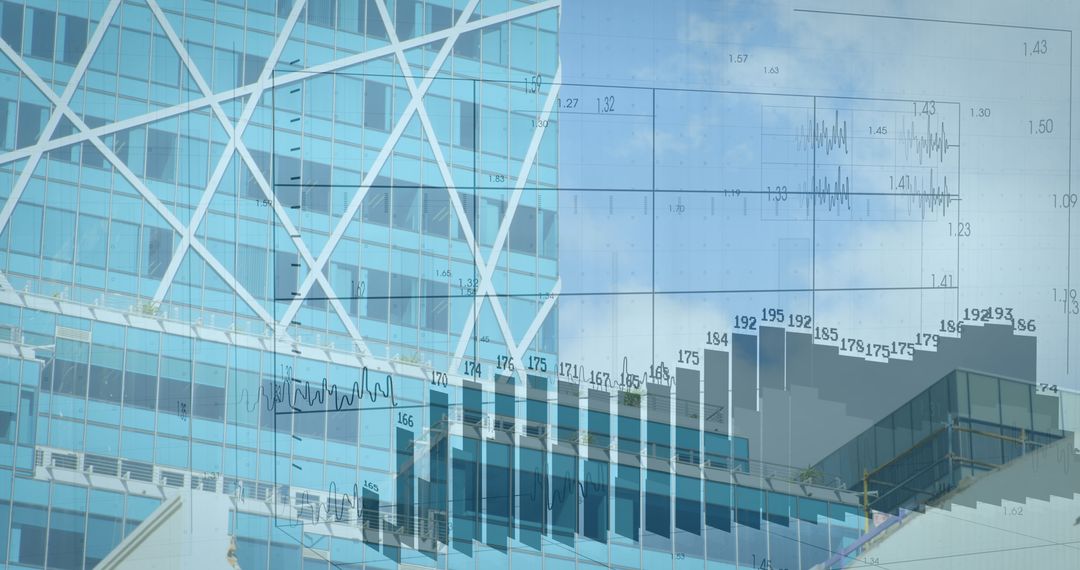
Financial Graph Overlays Modern Architecture Backdrop Image

Financial Graph Overlays Modern Architecture Backdrop

Visual combines elements of finance with urban architecture, making it ideal for use in financial services marketing, investment brochures, or news articles related to market analysis. The transparent graphs present layered data complexity over sleek structure, emphasizing analytics in the built environment.

Powered by Shutterstock logo - Get 15% off with code: PIKWIZARD15
Businessman using laptop computer analyzing sales data and financial growth graph chart report. Business planning, strategy and development. Financial accounting. market research, data analysis - Powered by Shutterstock - Get 15% off with code: PIKWIZARD15Businessman Drawing Upward Arrow on Digital Stock Market Graph with Trading Data, Buy and Sell Indicators, Representing Financial Growth, Investment Success Foreign currency trading and Forex Trading - Powered by Shutterstock - Get 15% off with code: PIKWIZARD15Businessman's Hand Holding Holographic Stock Market Growth Chart with Green Arrow Showing Positive Financial Trends and Stock Candlestick Data on Digital Interface and Finance - Powered by Shutterstock - Get 15% off with code: PIKWIZARD15Businessman pointing chart financial goals and economic business planning global. - Powered by Shutterstock - Get 15% off with code: PIKWIZARD15Woman hold smartphone use pc at workplace. Project stats financial data sales charts on laptop and cellphone screen, close up view over shoulder. Report preparation, synchronization for safety concept - Powered by Shutterstock - Get 15% off with code: PIKWIZARD15

Credit Photo

If you would like to credit the Photo, here are some ways you can do so

Free (free of charge)

Free for personal and commercial use.

Author: Creative Art

Similar Free Stock Images

Overlay of Financial Charts on Urban Architectural Skyline
Premium
Dashboard finance management on laptop computer analyzing sales data and growth graph chart report. Business planning, strategy and development. Financial accounting. market research, data analysis
Financial Data Overlay on Modern Cityscape Illustrating Global Business
Futuristic Data Processing Over Cityscape Visualizing Digital Concepts
Digital Data Analysis with Mathematical Equations Over Cityscape
Global Data Overlaid on City Skyline
Premium
Man look at the dashboard with graphs and charts. Concept of data management system, business intelligence, data statistics, marketing analysis, key performance indicators (KPI) and analytics.
Financial Data Overlay on Urban Skyline Symbolizing Tech Integration
Statistical Data Analysis with City View from Office
Financial Data Visualization Overlaying Business Meeting Scene
Financial Chart Overlay on Modern Glass Building for Market Analysis
Premium
Financial chart and investment graph analysis stock on tablet screen. Data dashboard and report insight for finance growth, stock market, and business performance strategy.
Digital Data Processing Superimposed on Urban Cityscape
Cityscape Reflections Intermingled with Technology Futures
Cityscape and Digital Charts Reflect Modern Business Analysis
Digital Graph Overlay on Evening Cityscape Symbolizing Data Analysis
Premium
Digital economic growth chart with a rising trend towards 2025, symbolizing future market predictions.
Digital Financial Analysis Over Modern Cityscape
Stock Market Data Overlay with Cityscape and Traffic
Global Financial Data Visualization Against Urban Backdrop
Digital Data Analysis Overlay on Cityscape Skyline
Premium
A professional businessman showcases stock market data through a digital interface, set against a modern city backdrop, emphasizing the importance of financial analysis in investment strategies.
Business Technology Fusion with Bicycle Commuting
Skyscrapers and Financial Charts Represent Economic Growth Dynamics
Urban Skyline Overlaid with Financial Graphs and Equations
Cityscape Embedded with Digital Data Interface Highlights
Premium
Stock Market Data Visualization and Financial Trading Analytics Dashboard on Touchscreen Tablet.
Abstract Financial Graphs and Charts Displayed Over Dark Background
Digital Financial Charts over Urban Cityscape Background
Financial Data Processing Over Cityscape with Mathematical Equations
Digital Financial Data and Urban Skyscraper Conceptual Image
Digital Financial Graphs with Urban Building Background
Financial Graphs Overlay on City Skyline at Dusk
Premium
Man look at the dashboard with graphs and charts. Concept of data management system, business intelligence, data statistics, marketing analysis, key performance indicators (KPI) and analytics.
Futuristic Data Visualization Over Modern Cityscape
Financial Analytics with Math Equations Overlaid on Cityscape
Digital Financial Chart Overlay on Urban Skyline
Financial Data Overlaid on Business Professionals with Charts
Premium
Businesswoman analyzes to chart data business on a visual screen dashboard, technology devices and screens visible in the background, financial planning, market research, and the stock market.
Financial Data Visualizations Overlapping Cityscape
Stock Market Analysis and Urban Skyline Business Growth
Statistical Data Processing with Night City Background
Financial Graphs Over Cityscape Representing Global Trade and Economy
Premium
Businessman using digital tablet analyzing sales data and financial growth graph chart report. Business planning, strategy and development. Financial and banking. market research, business analysis
Business Data Analytics Overlooking Financial District
Financial Graphs Overlay Against Cityscape Skyline View
Dynamic Cityscape with Financial Graphs Overlay at Night
Financial Graph Overlay on Urban Buildings Background
Premium
Businessman in suit analyzes stock market data using digital tablet and stylus with financial charts in the background. Investment, finance, trading. Stock market and analytics.
Financial Market Data Overlaying Cityscape Illustrates Economic Trends
Digital Composite of Urban Business and Technology Themes
Renewable Energy Financial Analysis with Global Business Concepts
Financial Data Overlay on Cityscape Illustrating Market Analytics
Premium
Businessman analyzing stock market chart with stylus pen on virtual screen, representing financial trading, investment analysis, and stock market data visualization
Futuristic Sky and Finance: Downtown Merged with Digital Graphics
Business Data Analytics Overlaid on Cityscape
Financial Data Overlay and Road Traffic for Sustainable Transport
Global Businesspeople Overlaid with Financial Data and Cityscape
Premium
Profile of woman and financial technology concept. Artificial intelligence. Wide angle visual for banners or advertisements.
Futuristic Data Visualization Overlaying Cityscape
Financial Data and Mathematical Graphs Overlay on City Skyline
Financial Charts with City Skyline Overlay at Dusk
Skyscrapers with Financial Charts Overlay Indicating Economic Growth
Digital Finance Concept Overlaying Modern Office Building
Digital Data Interface with Urban Skyscrapers
Premium
Display of quotes pricing graph visualization.  Financial statistic analysis on dark background with growing financial charts. Stock analyzing. Price chart bars.
Data Processing and Analytics in Modern Cityscape
Data Visualization with Financial Graphs in Modern Office
Digital Financial Analytics Over Modern Cityscape
Financial Data Processing Art Over Modern Office Building
Premium
Touching stock market graph on a touch screen device. Trading on stock market concept. Closeup photo.
Financial Data Analysis Overlay on Cityscape Background
Digital Data Processing with Cityscape and Graphs Overlay
Dynamic Financial Graphs Overlaying Cityscape for Global Economy
Business Urban Data with Digital Analytics Overlay
Premium
A magnifying glass over a financial chart, illustrating market analysis and business concepts, in blue light against a dark background.
Advanced Business Data Analytics over Urban Cityscape
Financial Graph Motion with Urban Skyline Background
Stock Market Graph Overlay with Urban Building Background
Financial Data Rendering Over Urban Cityscape at Dusk
Premium
Explore the stock market trends for 2024 with analytical visuals of businessman planning long term investments and future business growth, Navigate towards success with smart strategies.
Dynamic Data Visualization with Financial Charts and Bar Graphs
Futuristic Cityscape Infused with Data and Technology Overlay
Financial Data Analysis Overlapping Urban Skyline Depiction
Financial Data Overlay on Modern Building Architecture
Premium
Showing digital market display scrolling stock symbols on dark grid, with yellow line graphs. Financial technology, data visualization, stock market analysis, trading platform, digital interface,
Cityscape with Digital Financial Data Integration
Cityscape Overlay with Financial Data Charts and Graphs
Digital Financial Data Analytics Over Modern Cityscape Background
Financial Data and Stock Market Trends Over Urban Skyline
Premium
Above top desk of SME owner people home office call talk in SEO chart sale report paper or stock graph big data. Woman remote study MBA digital learn online of job career reskill upskill work plan.
Financial Data Over City Background Innovation
Digital Financial Analysis Overlaid on Modern City Skyline
Financial Graph Analysis Overlapping Urban Architecture
Financial Data and Statistics Overlay on City Buildings
Data Processing Visual Over Urban Cityscape
Statistical Graphs Overlay Tall Urban Skyscraper at Night
Premium
Futuristic Digital Growth Chart – 3D Bar Graph with Glowing Blue Data Visualization
Futuristic Data Visualizations on Urban Cityscape Billboard
Financial Data Visualization over Escalator Symbolizing Economic Momentum
Data Analytics Overlay on Urban Landscape
Finance Professional Analyzing Stock Market Data Indoors
Premium
Professional Financial Data Analysts Working in a Modern Monitoring Office with Live Analytics Feed on a Big Digital Screen. Monitoring Room with Finance Specialists Sit in Front of Computers.
Financial Graphs and Cityscape Represent Global Trade
Dynamic Financial Graphs Overlapping Urban Cityscape
Digital Financial Graphs Overlaying Modern Cityscape View
Abstract Digital Data and Cityscape Overlay
Premium
Persons Hand Holding Tablet Digital Financial Graph Analysis, Upward Chart Showing Growth, Business Interface, Stock Market Data, Smartphone Interaction
Modern Financial Graphs Overlapping Urban High-Rise Buildings
Business Charts Overlay with Urban Building Background
Financial Data Overlay on Cityscape Reflects Global Commerce
Financial Market Data Overlay on Urban Skyscrapers
Premium
Financial graph with a red falling trend line overlay on a cityscape background, symbolizing a market downturn and financial crisis
Financial Data Interface with Urban Cityscape Backdrop
Data Graph Overlay with Skyscraper Background
Financial Data Analytics Overlaying Urban Skylines
Financial Strategies Driving Urban Growth Against City Background
Premium
A vibrant financial chart displays stock market data against a city skyline at dusk, emphasizing dynamic market fluctuations
Financial Data Overlay on Urban Cityscape Depicting Global Trade
Global Financial Data Processing Over Cityscape Elements
Digital Data Processing and Financial Growth over Cityscape
Digital Financial Graphs Overlay City Buildings at Night
Premium
Professional Financial Data Analysts Working in a Modern Monitoring Office with Live Analytics Feed on a Big Digital Screen. Monitoring Room with Finance Specialists Sit in Front of Computers.
Urban Financial Analytics with Overlaid Stock Charts