- Home >
- Stock Photos >
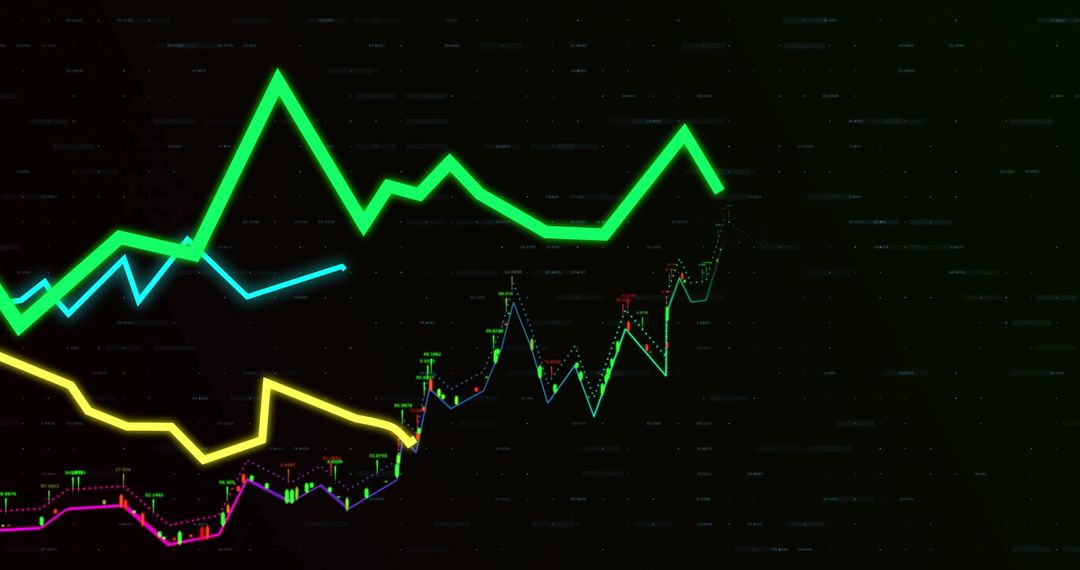
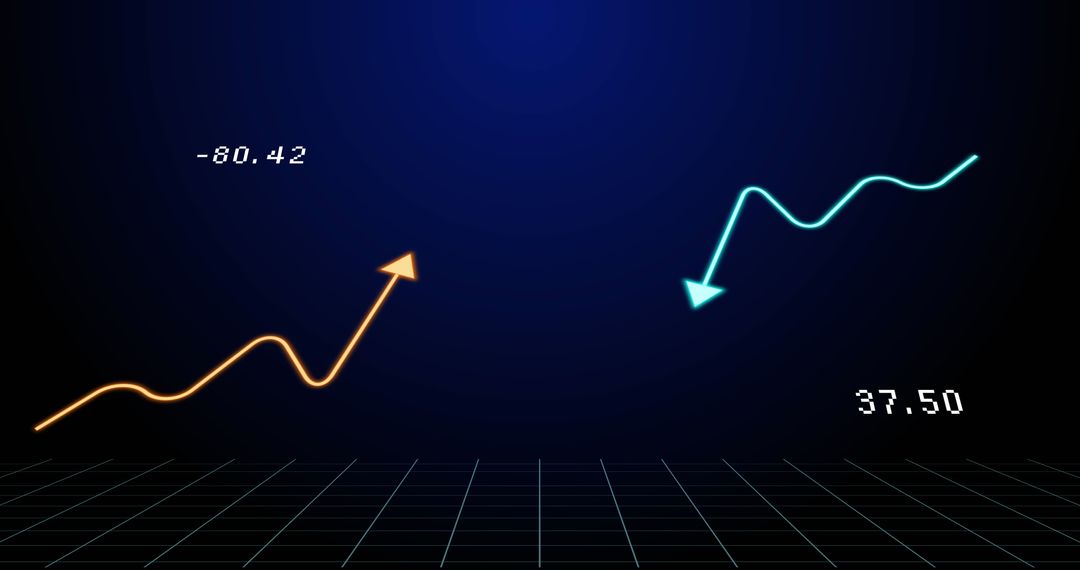
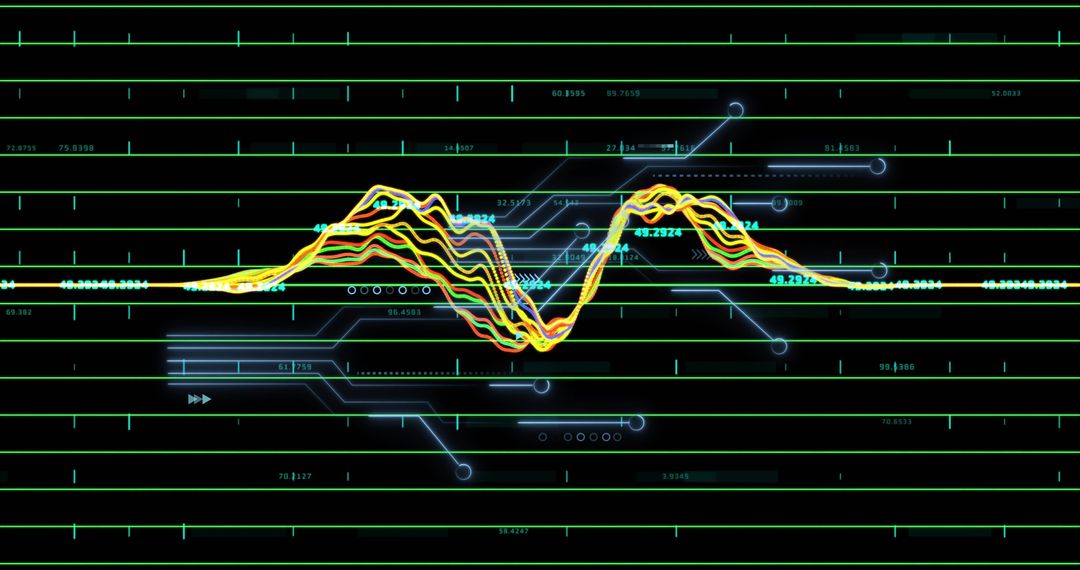
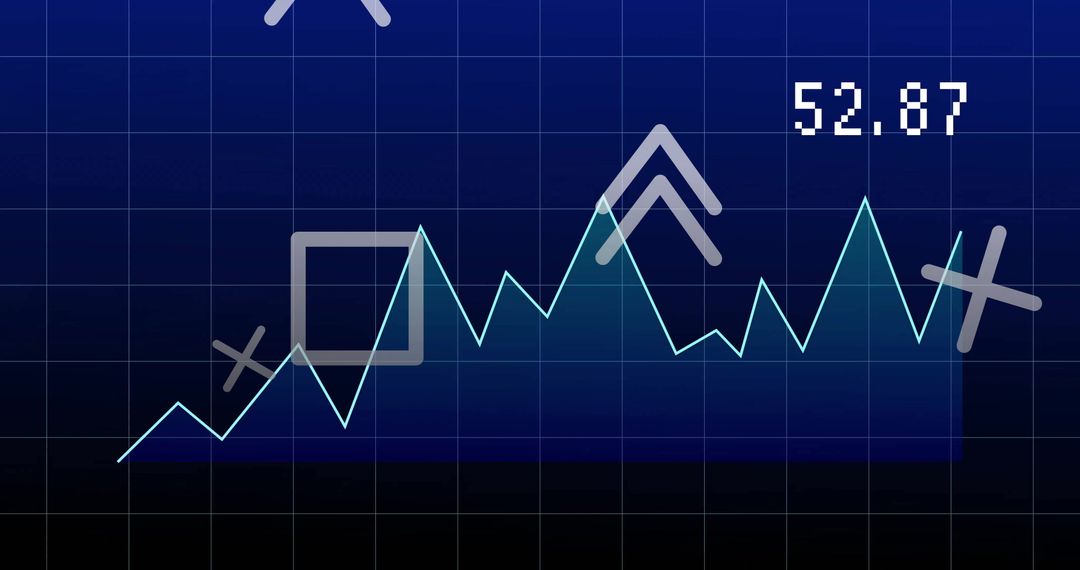
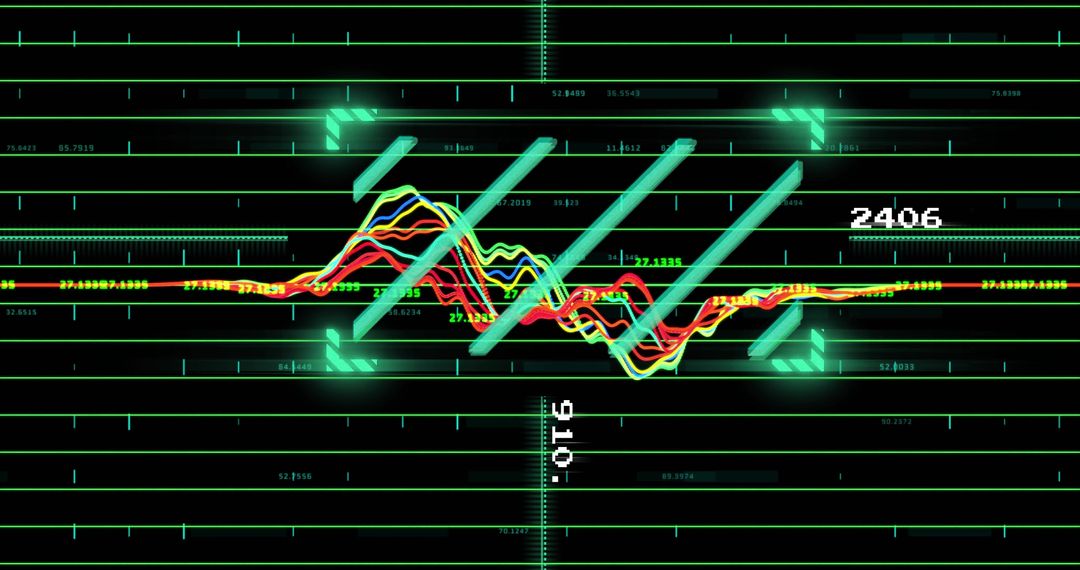
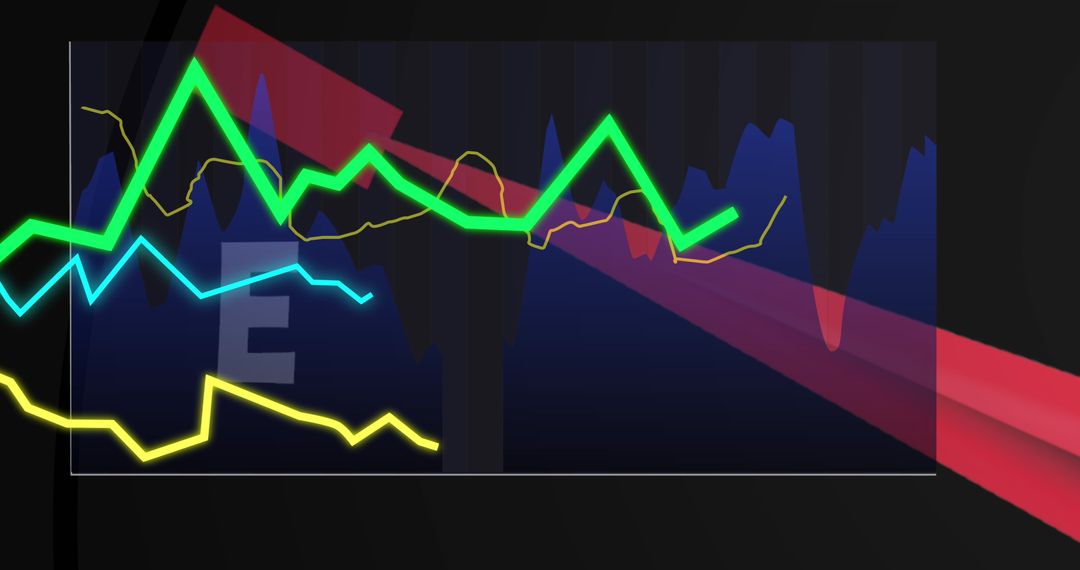
- Financial Graph with Line Trending Upwards on Navy Background
Financial Graph with Line Trending Upwards on Navy Background Image

This visualization shows a dynamic financial graph with lines representing market data. It features neon-colored lines against a navy backdrop, indicating changes in values with precision. Ideal for representing financial reports, presentations on market trends, or illustrating the impact of new economic data.
Powered by 


2
downloads
downloads
Tags:
More
Credit Photo
If you would like to credit the Photo, here are some ways you can do so
Text Link
photo Link
<span class="text-link">
<span>
<a target="_blank" href=https://pikwizard.com/photo/financial-graph-with-line-trending-upwards-on-navy-background/c8d1ec35dba9a3def5bb2db69447f839/>PikWizard</a>
</span>
</span>
<span class="image-link">
<span
style="margin: 0 0 20px 0; display: inline-block; vertical-align: middle; width: 100%;"
>
<a
target="_blank"
href="https://pikwizard.com/photo/financial-graph-with-line-trending-upwards-on-navy-background/c8d1ec35dba9a3def5bb2db69447f839/"
style="text-decoration: none; font-size: 10px; margin: 0;"
>
<img src="https://pikwizard.com/pw/medium/c8d1ec35dba9a3def5bb2db69447f839.jpg" style="margin: 0; width: 100%;" alt="" />
<p style="font-size: 12px; margin: 0;">PikWizard</p>
</a>
</span>
</span>
Free (free of charge)
Free for personal and commercial use.
Author: Authentic Images
Similar Free Stock Images

Premium


Premium


Premium


Premium


Premium


Premium


Premium


Premium


Premium


Premium


Premium


Premium


Premium


Premium


Premium


Premium


Premium


Premium


Premium


Premium


Premium


Premium


Premium


Premium