- Home >
- Stock Photos >
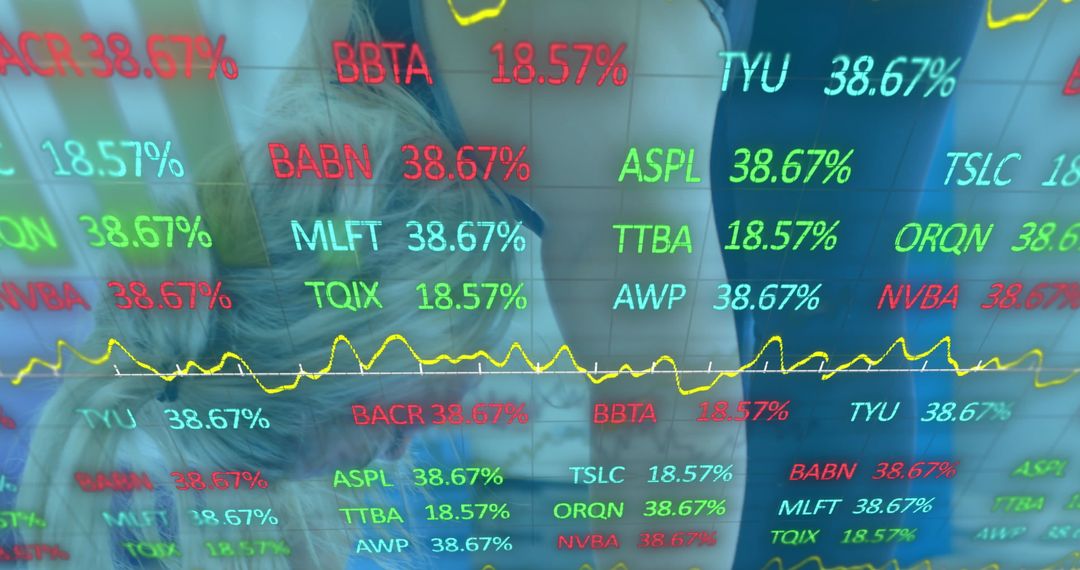
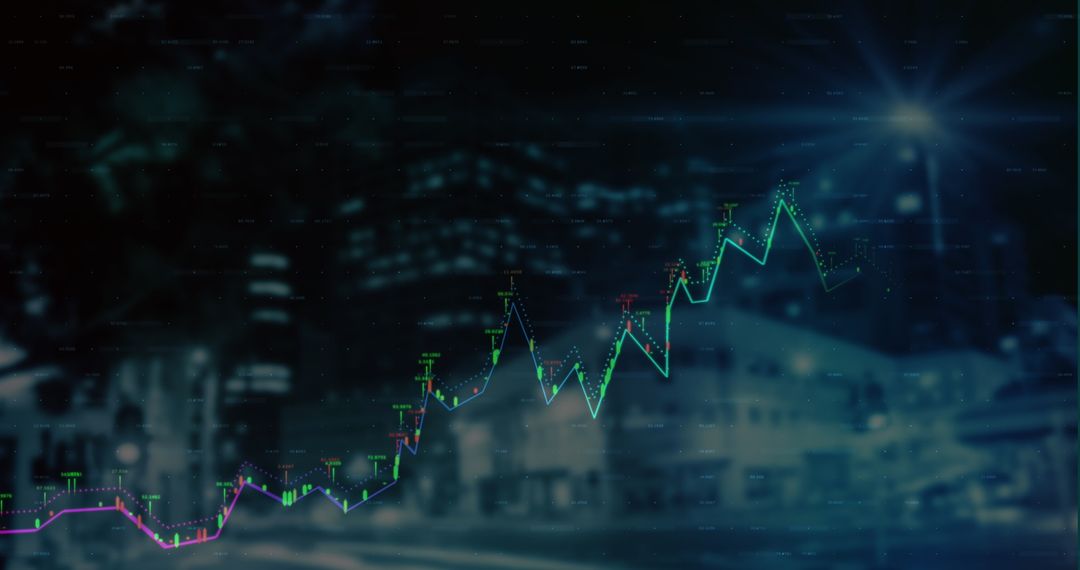
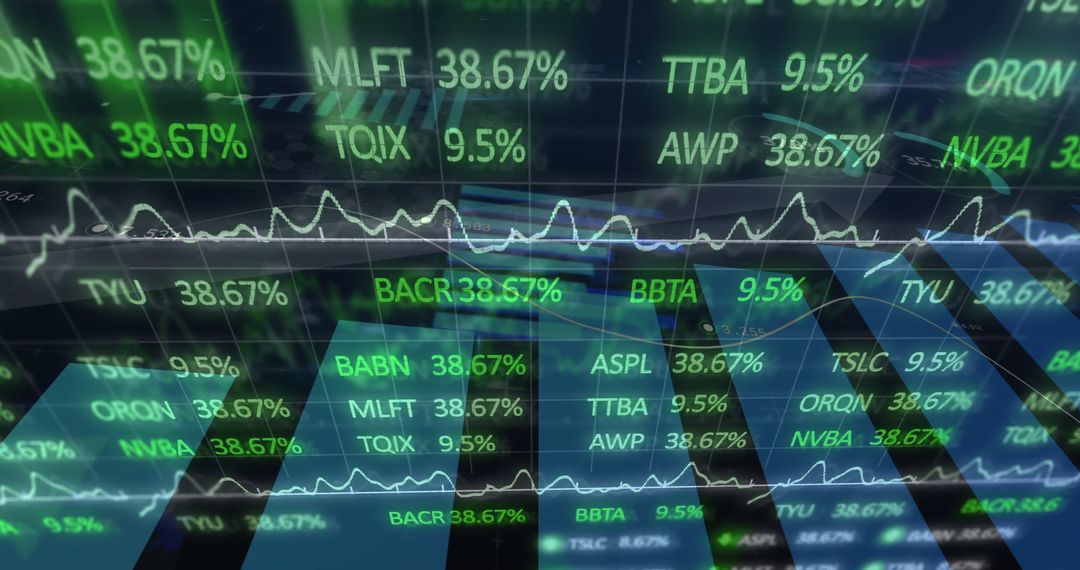
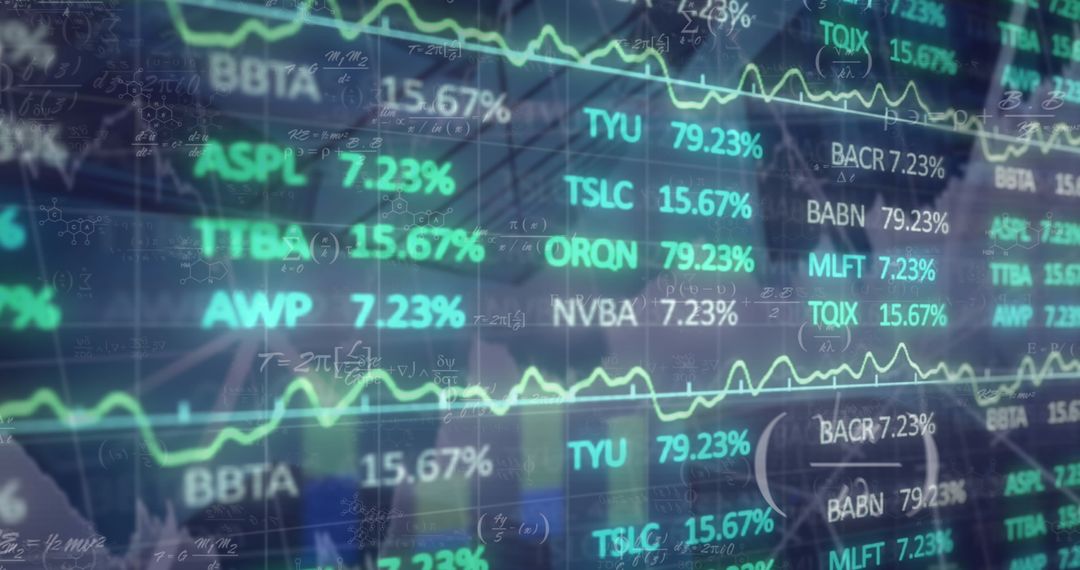
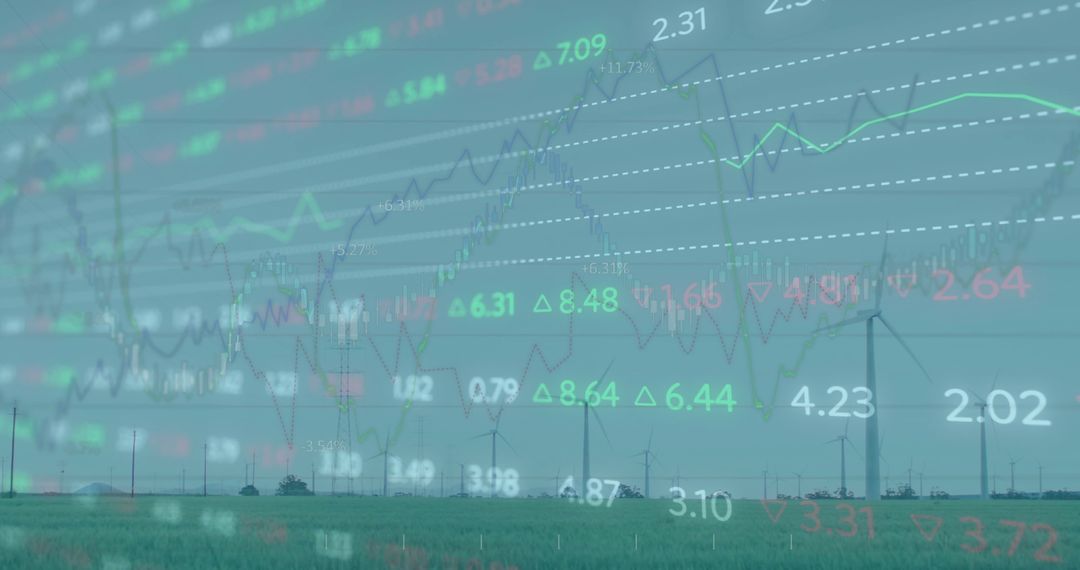
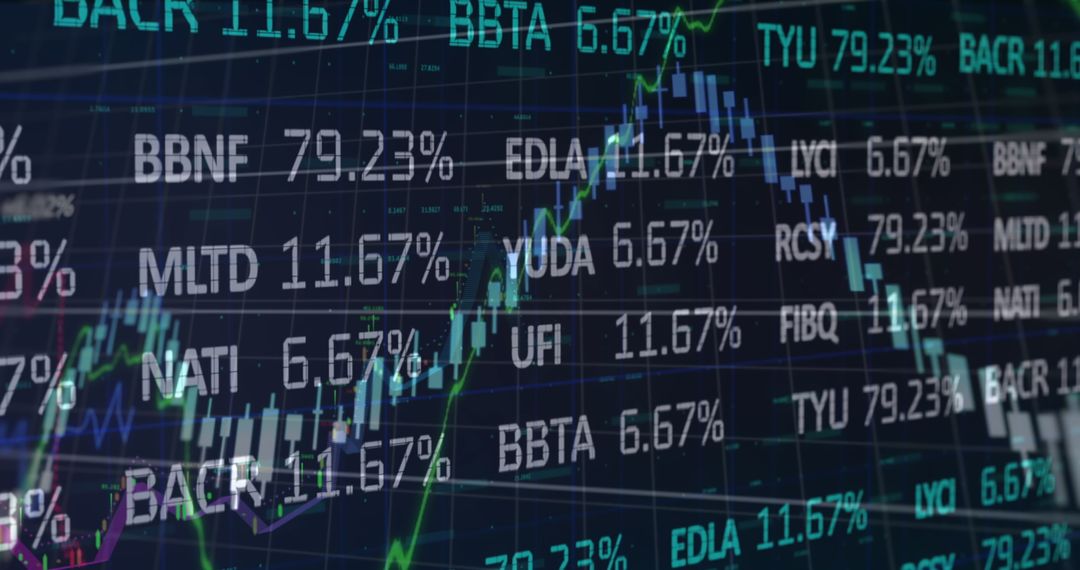
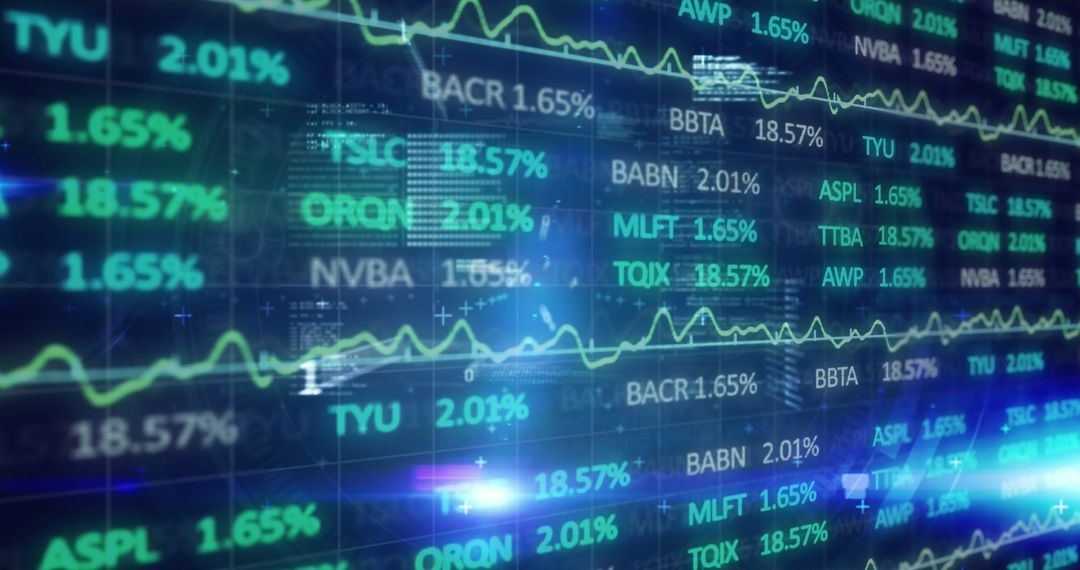
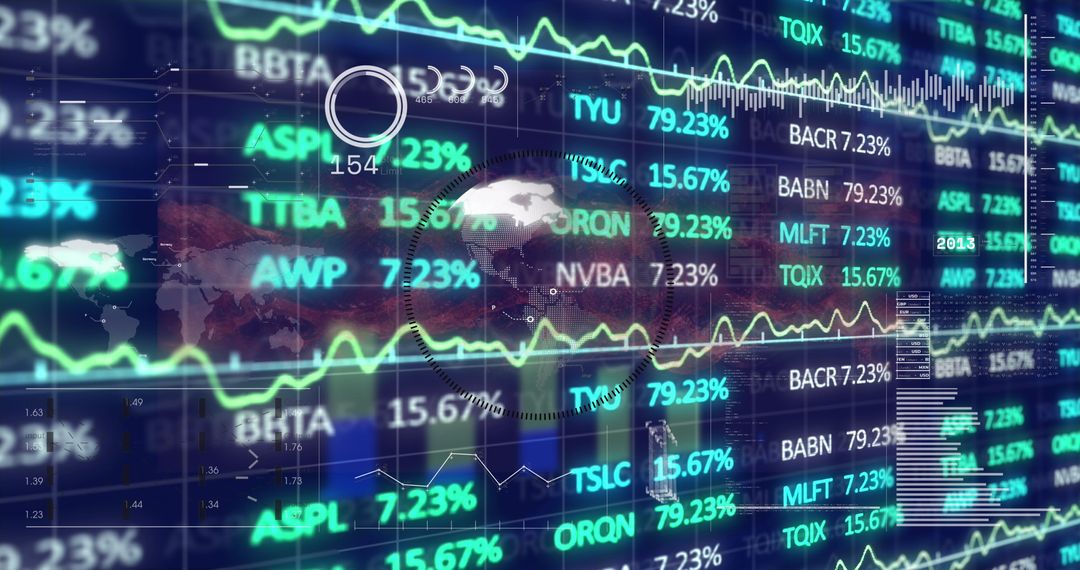
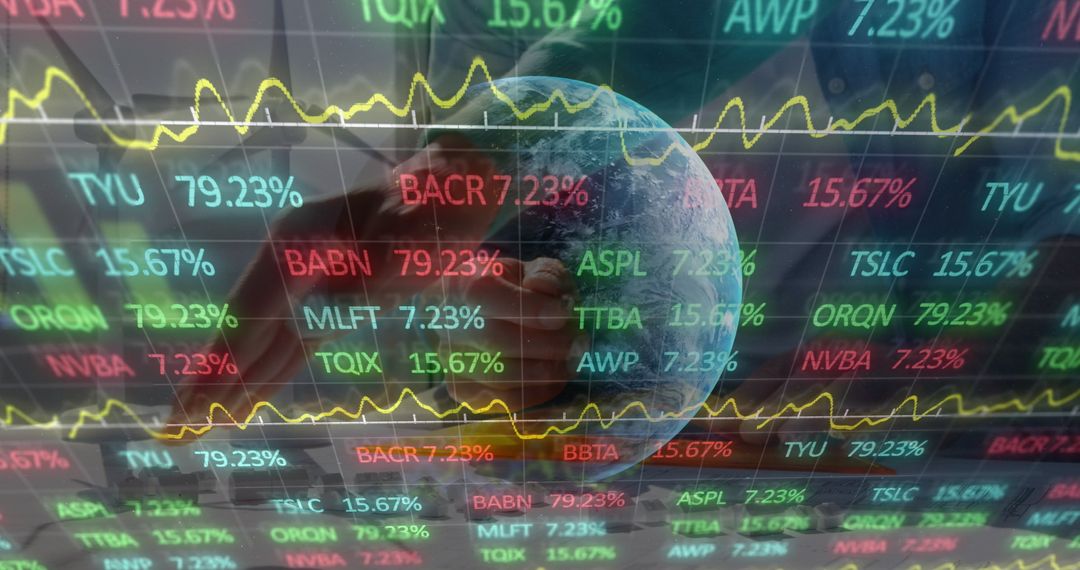
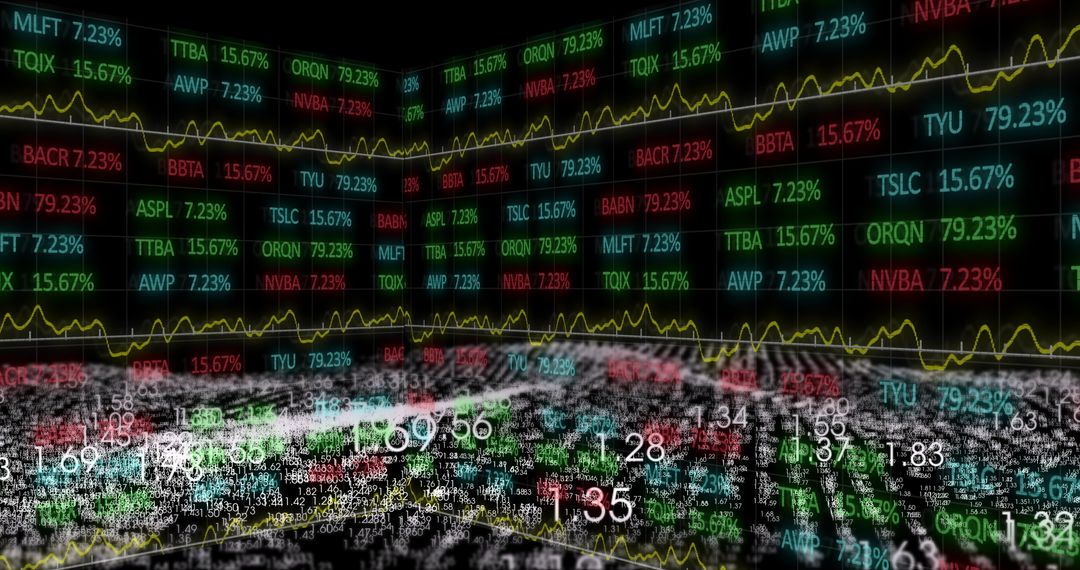
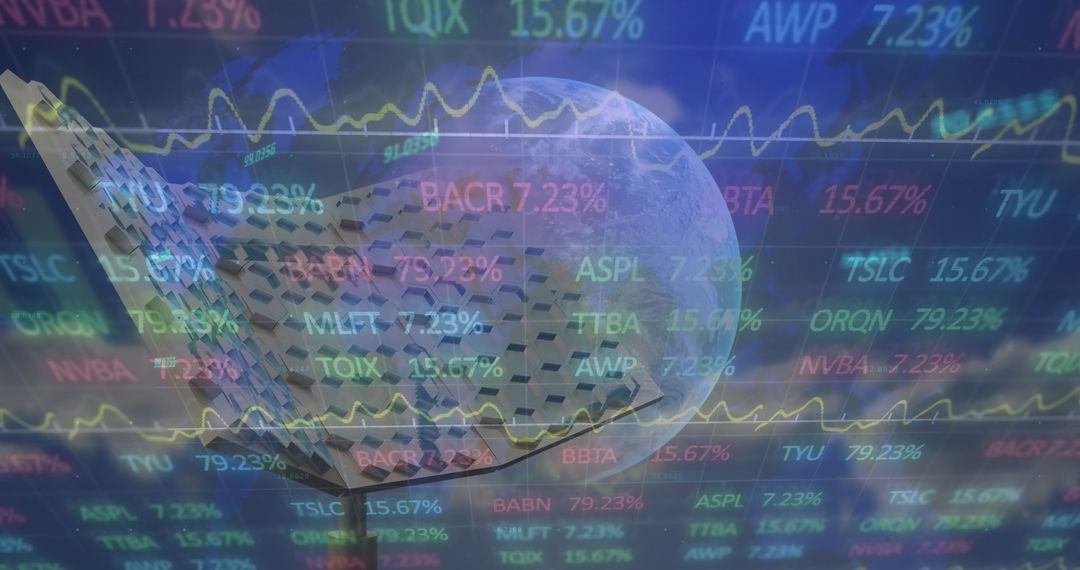
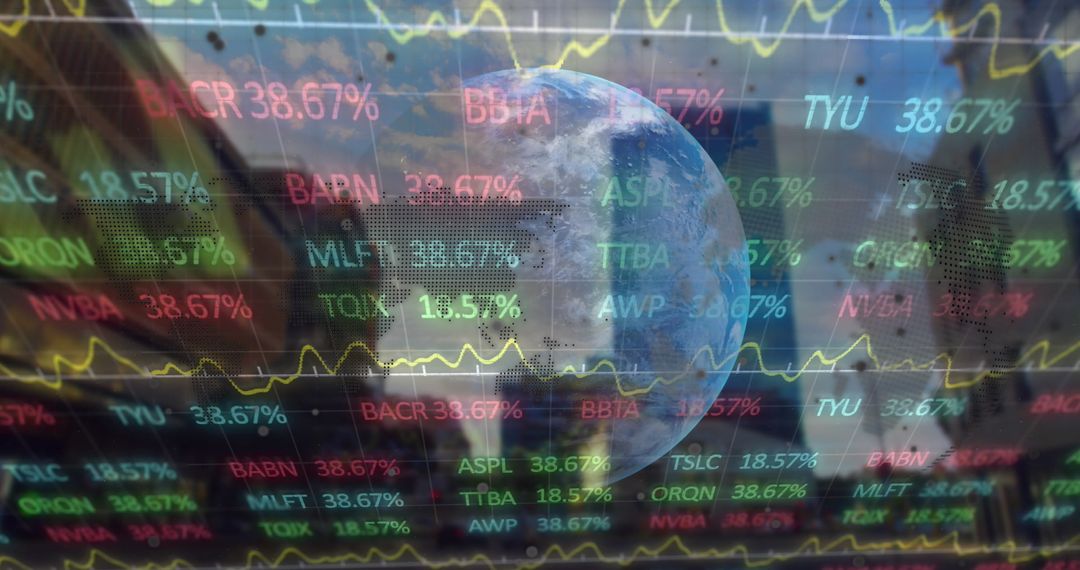
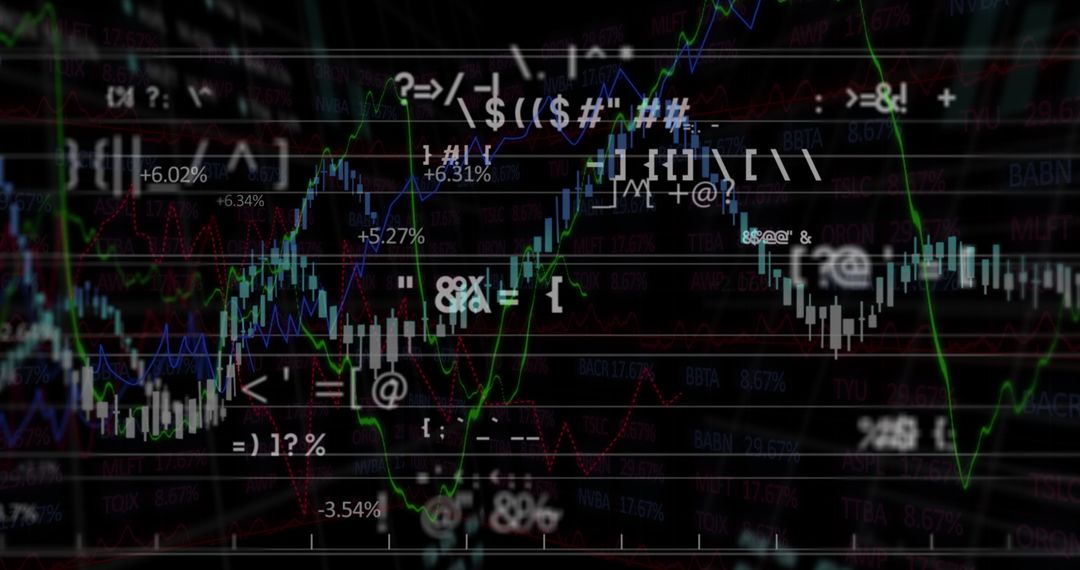
- Financial Graph with Mathematical and Chemical Inscriptions
Financial Graph with Mathematical and Chemical Inscriptions Image
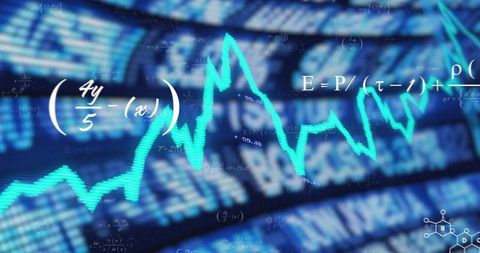
The image features a dynamic turquoise line graph representing financial data against a backdrop of blurred ticker symbols and complex mathematical formulas. It includes a chemical diagram, integrating elements of cross-disciplinary studies in science and finance. This visual can be used for presentations on financial analytics, tech-driven market predictions, and innovative approaches in investment strategies. It is ideal for financial tech startups, educational materials, or blog articles discussing the fusion of mathematics and chemistry in solving complex market trends.
Powered by 


0
downloads
downloads
Tags:
More
Credit Photo
If you would like to credit the Photo, here are some ways you can do so
Text Link
photo Link
<span class="text-link">
<span>
<a target="_blank" href=https://pikwizard.com/photo/financial-graph-with-mathematical-and-chemical-inscriptions/f8ff84f0e2a67db50505d40cbefb8d3b/>PikWizard</a>
</span>
</span>
<span class="image-link">
<span
style="margin: 0 0 20px 0; display: inline-block; vertical-align: middle; width: 100%;"
>
<a
target="_blank"
href="https://pikwizard.com/photo/financial-graph-with-mathematical-and-chemical-inscriptions/f8ff84f0e2a67db50505d40cbefb8d3b/"
style="text-decoration: none; font-size: 10px; margin: 0;"
>
<img src="https://pikwizard.com/pw/medium/f8ff84f0e2a67db50505d40cbefb8d3b.jpg" style="margin: 0; width: 100%;" alt="" />
<p style="font-size: 12px; margin: 0;">PikWizard</p>
</a>
</span>
</span>
Free (free of charge)
Free for personal and commercial use.
Author: Awesome Content
Similar Free Stock Images
Premium