
- Home >
- Stock Photos >
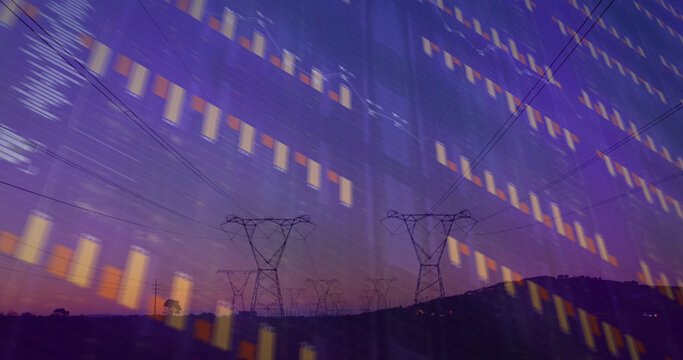
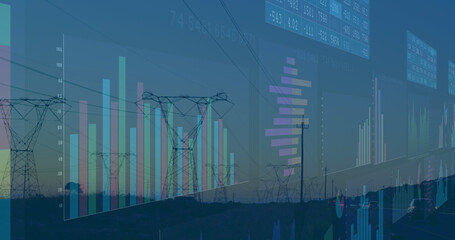
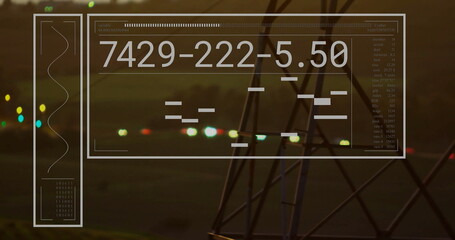
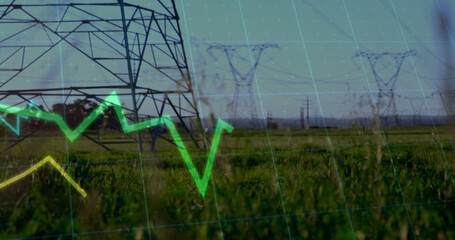
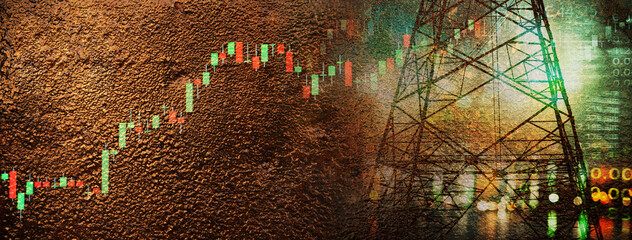
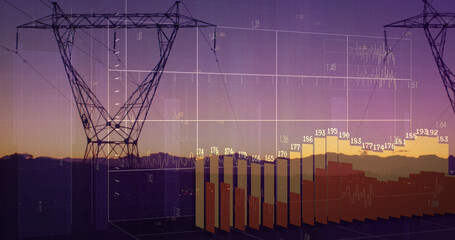
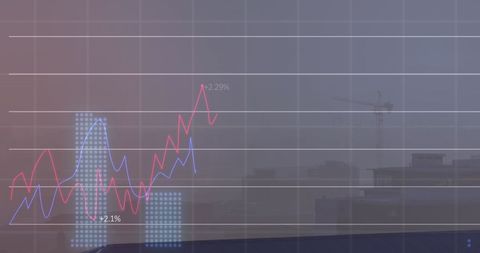
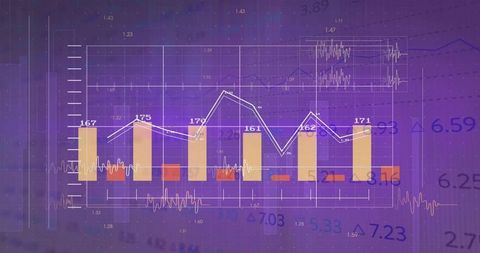
- Financial Graphics Overlap with Electrical Power Lines
Financial Graphics Overlap with Electrical Power Lines Image

Illustration of financial graphs superimposed on images of electric pylons represents the intersection of finance with the energy sector. It showcases trends and data analytics in a digital format involving economics and energy distribution. This can be used in content related to finance, energy markets, data analytics, or technological developments in industry sectors.
Powered by 


downloads
Tags:
More
Credit Photo
If you would like to credit the Photo, here are some ways you can do so
Text Link
photo Link
<span class="text-link">
<span>
<a target="_blank" href=https://pikwizard.com/photo/financial-graphics-overlap-with-electrical-power-lines/b13cddffb4aa345470c84f2a4e2e0100/>PikWizard</a>
</span>
</span>
<span class="image-link">
<span
style="margin: 0 0 20px 0; display: inline-block; vertical-align: middle; width: 100%;"
>
<a
target="_blank"
href="https://pikwizard.com/photo/financial-graphics-overlap-with-electrical-power-lines/b13cddffb4aa345470c84f2a4e2e0100/"
style="text-decoration: none; font-size: 10px; margin: 0;"
>
<img src="https://pikwizard.com/pw/medium/b13cddffb4aa345470c84f2a4e2e0100.jpg" style="margin: 0; width: 100%;" alt="" />
<p style="font-size: 12px; margin: 0;">PikWizard</p>
</a>
</span>
</span>
Free (free of charge)
Free for personal and commercial use.
Author: Authentic Images
Similar Free Stock Images

Premium


Premium


Premium


Premium


Premium


Premium


Premium


Premium


Premium


Premium

Premium


Premium


Premium


Premium
Premium


Premium


Premium


Premium


Premium


Premium


Premium


Premium


Explore More Free Stock Images