- Home >
- Stock Photos >
- Financial Graphs and Analysis on Digital Interface
Financial Graphs and Analysis on Digital Interface Image

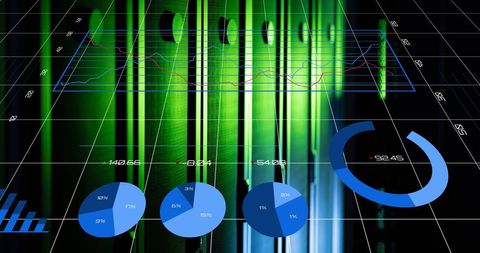
Visual showing detailed financial graphs over a digital interface captures concepts of data analysis and business intelligence. Useful for articles or presentations that focus on the stock market, trading strategies, and implementing financial technology in modern business practices.

downloads
Tags:
More
Credit Photo
If you would like to credit the Photo, here are some ways you can do so
Text Link
photo Link
<span class="text-link">
<span>
<a target="_blank" href=https://pikwizard.com/photo/financial-graphs-and-analysis-on-digital-interface/35d1cb5291762c5535485af8664c3da3/>PikWizard</a>
</span>
</span>
<span class="image-link">
<span
style="margin: 0 0 20px 0; display: inline-block; vertical-align: middle; width: 100%;"
>
<a
target="_blank"
href="https://pikwizard.com/photo/financial-graphs-and-analysis-on-digital-interface/35d1cb5291762c5535485af8664c3da3/"
style="text-decoration: none; font-size: 10px; margin: 0;"
>
<img src="https://pikwizard.com/pw/medium/35d1cb5291762c5535485af8664c3da3.jpg" style="margin: 0; width: 100%;" alt="" />
<p style="font-size: 12px; margin: 0;">PikWizard</p>
</a>
</span>
</span>
Free (free of charge)
Free for personal and commercial use.
Author: Creative Art