- Home >
- Stock Photos >
- Financial Graphs and Charts on Digital Interface
Financial Graphs and Charts on Digital Interface Image

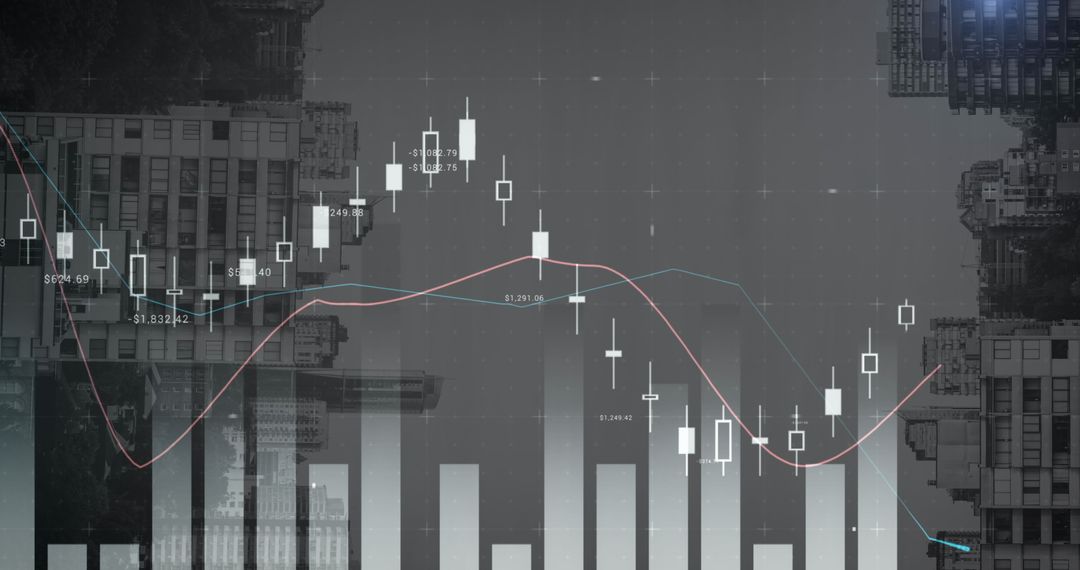
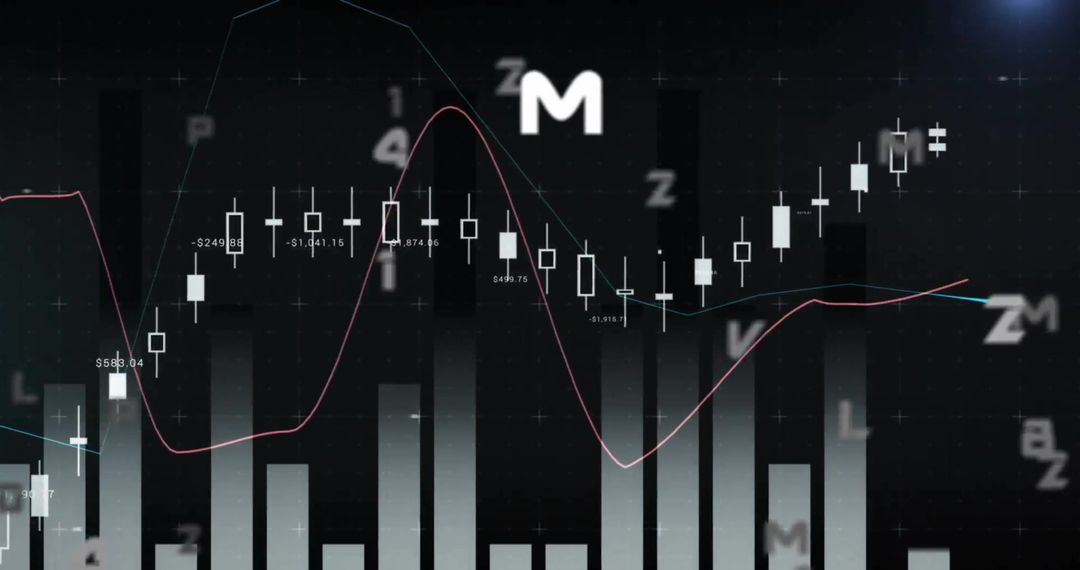
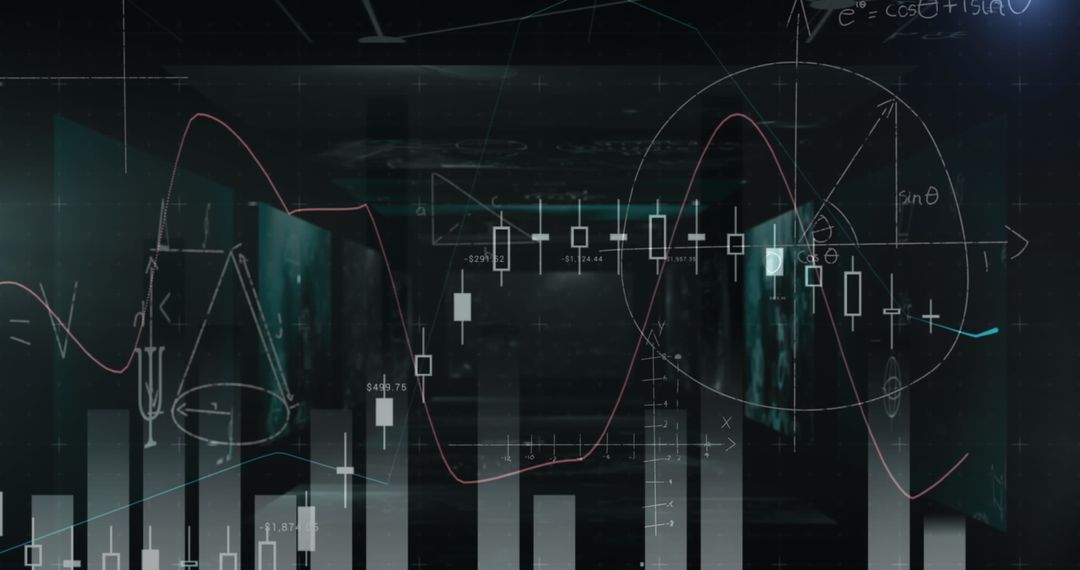
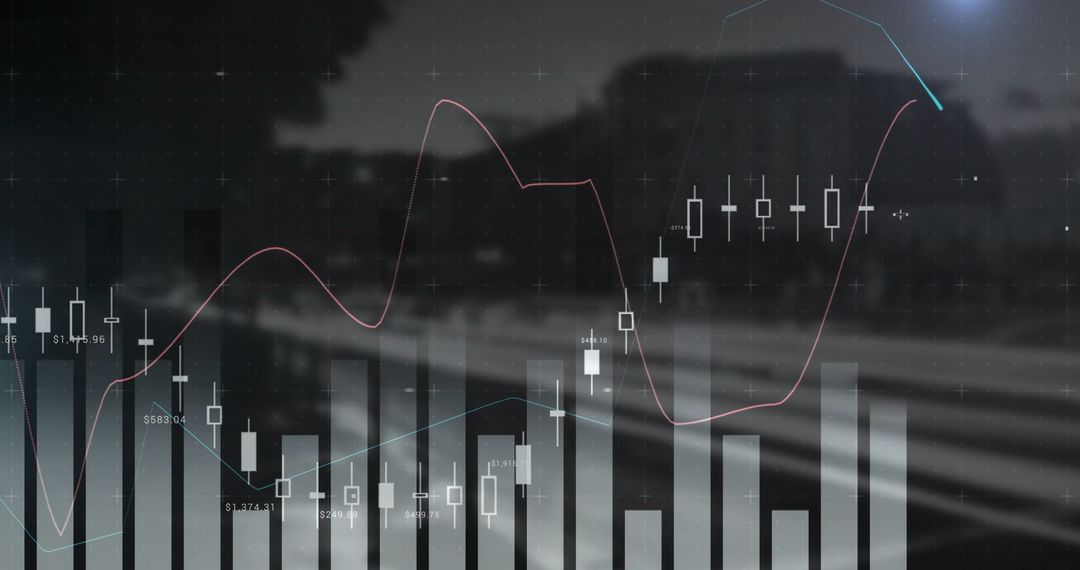
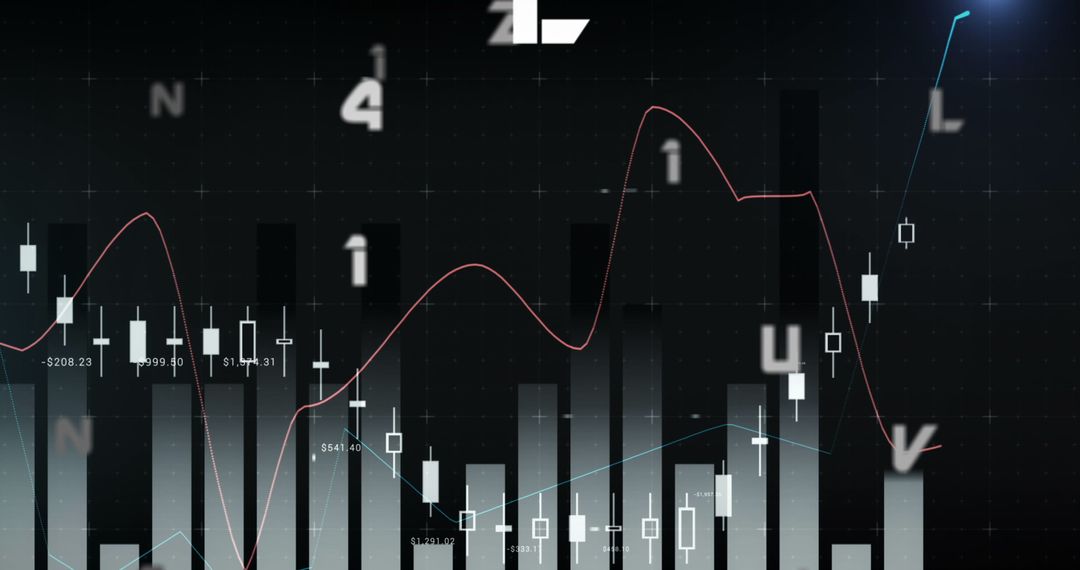
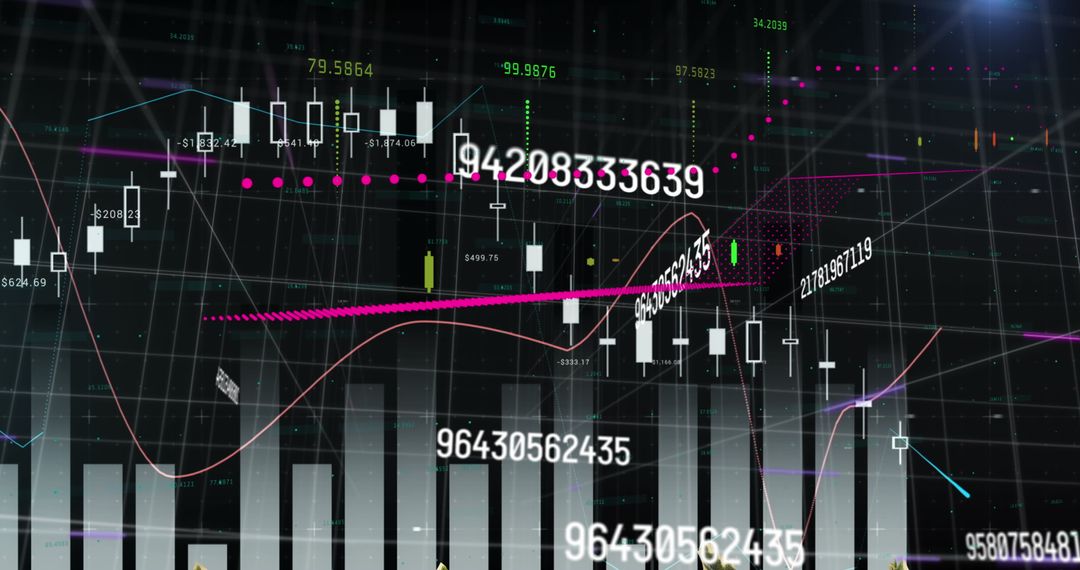
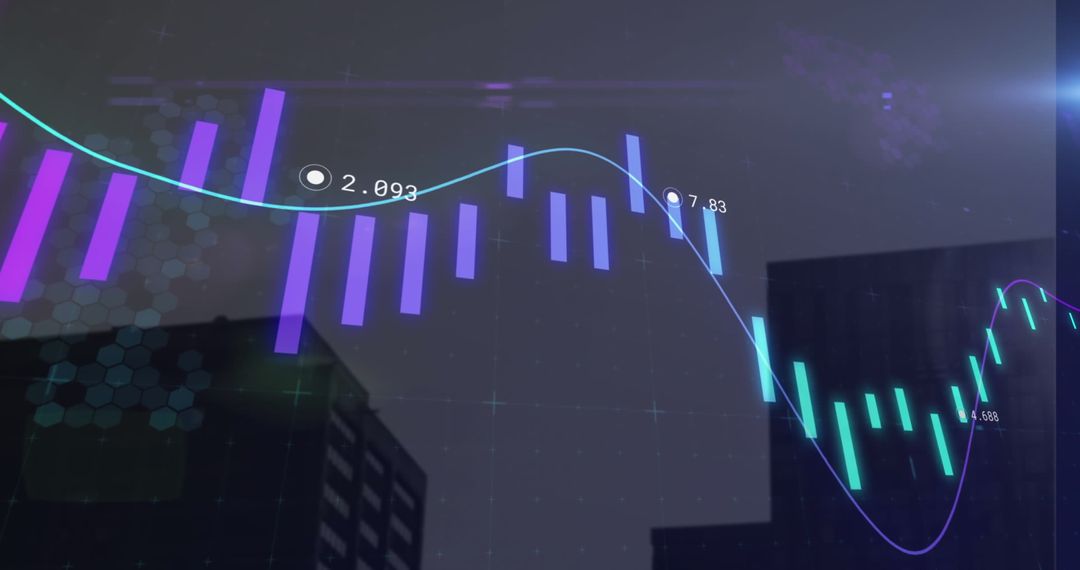
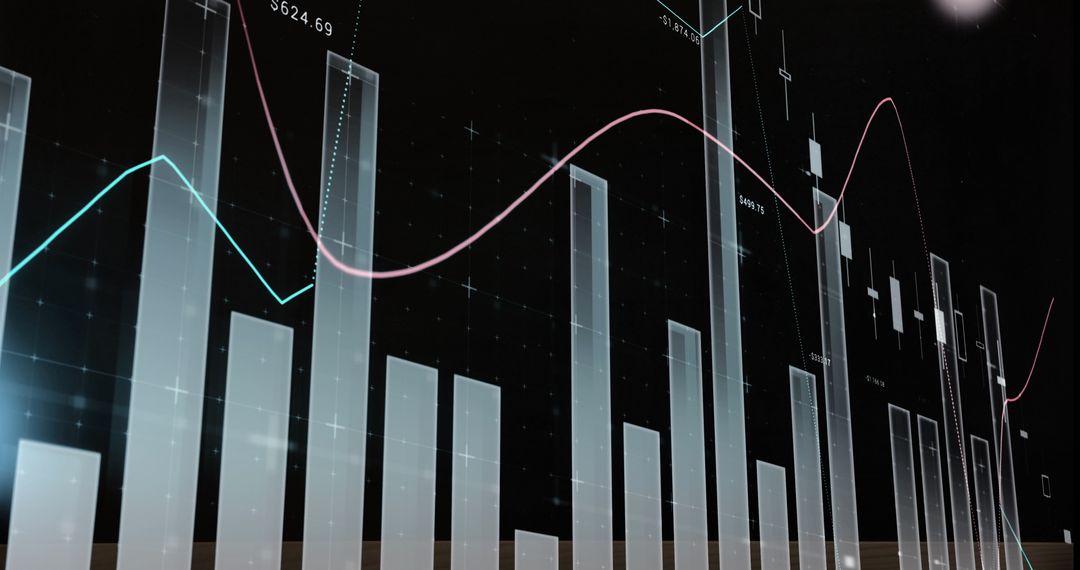
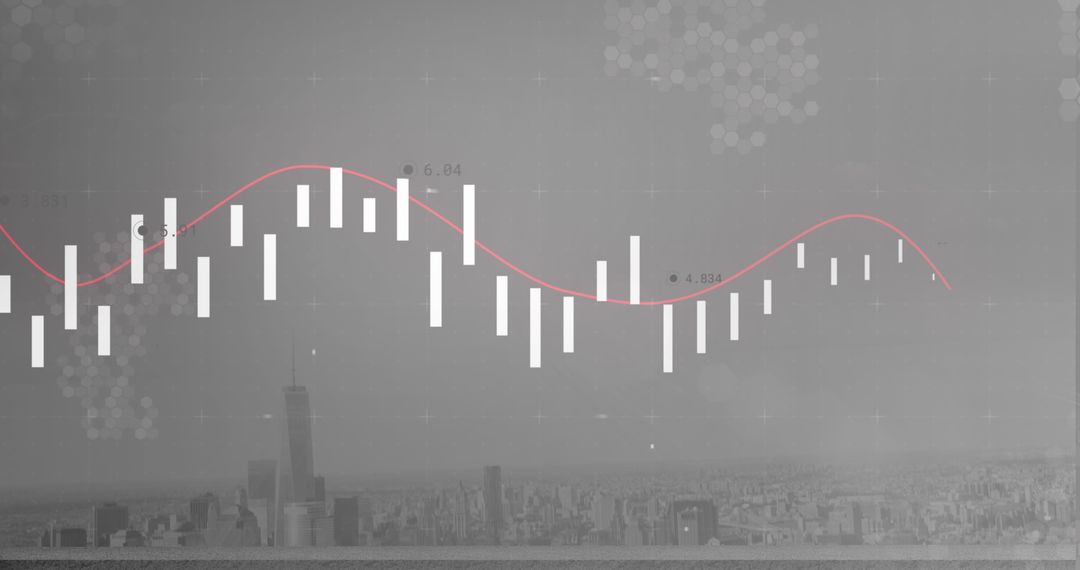
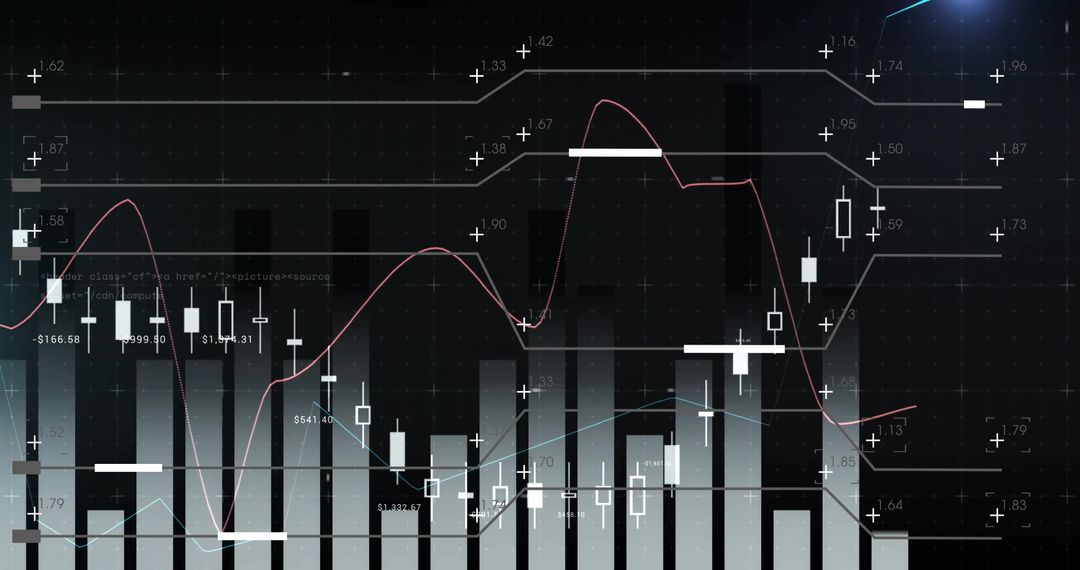
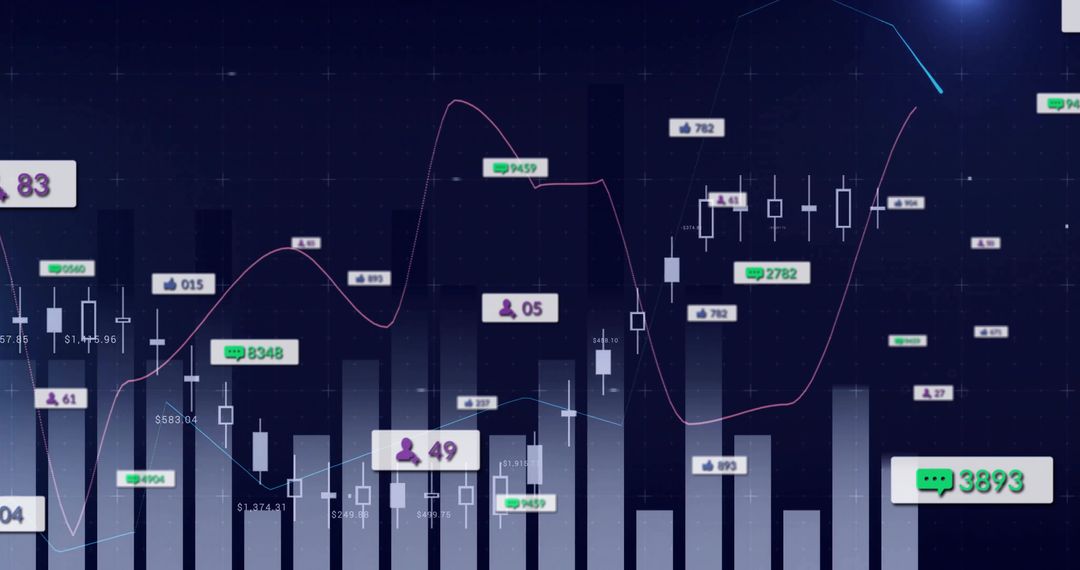
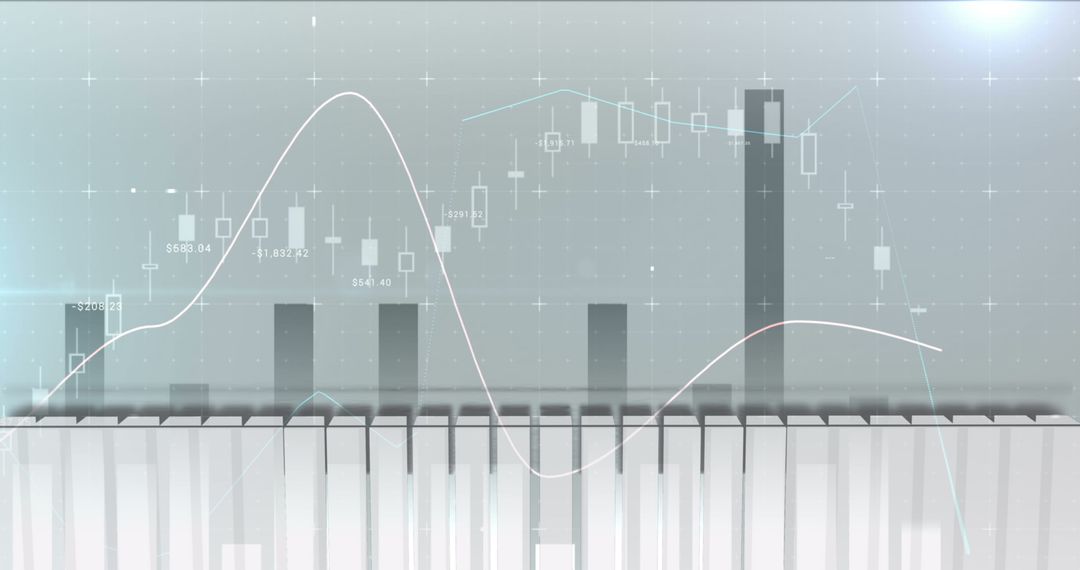
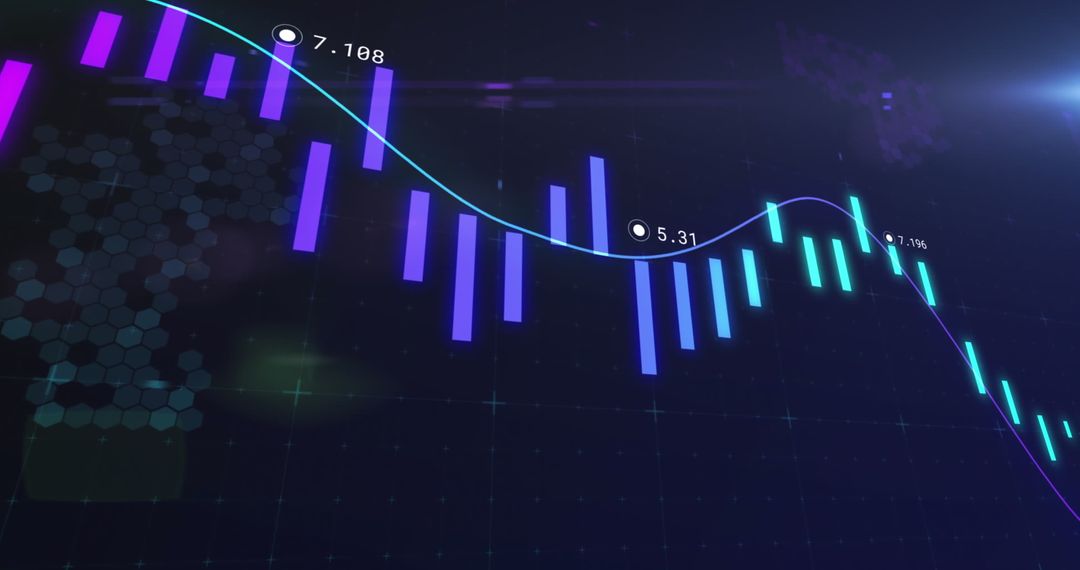
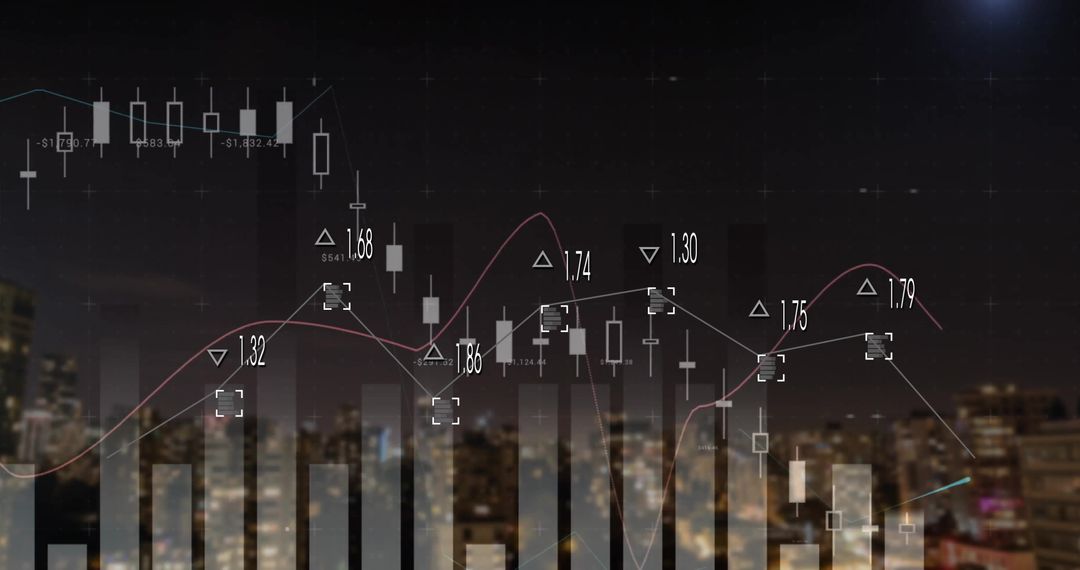
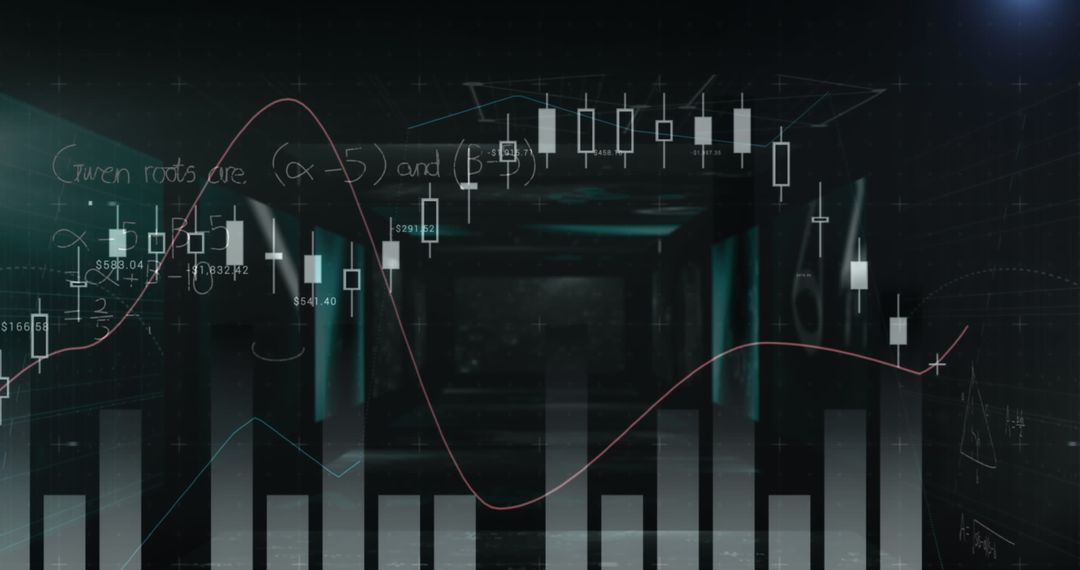
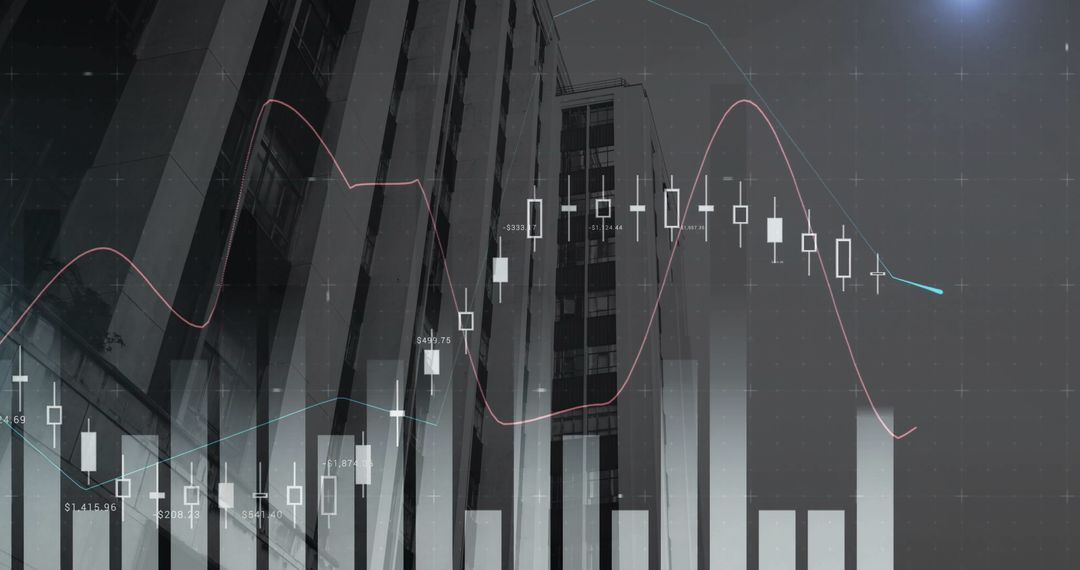
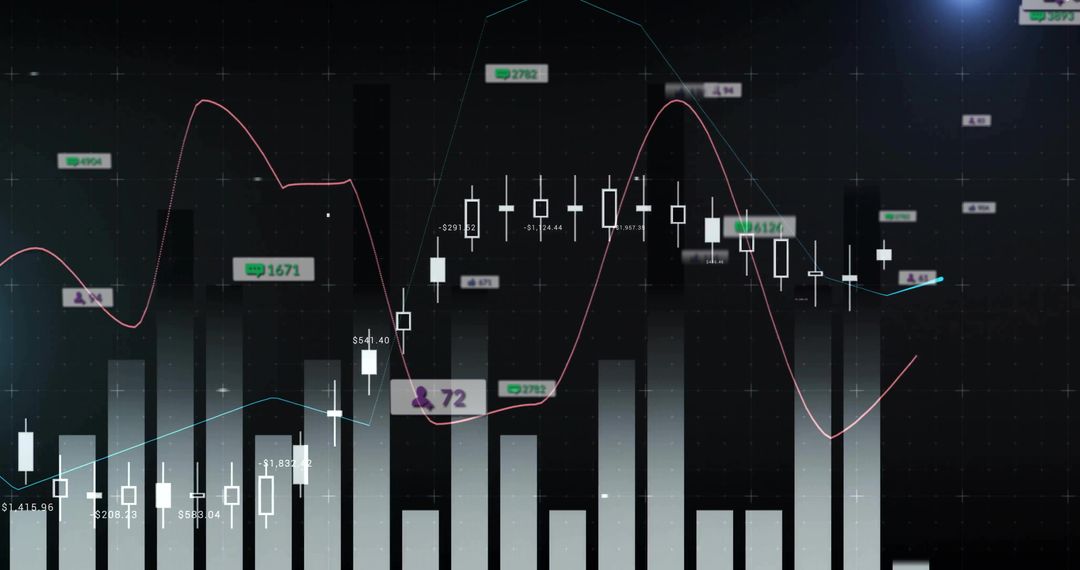
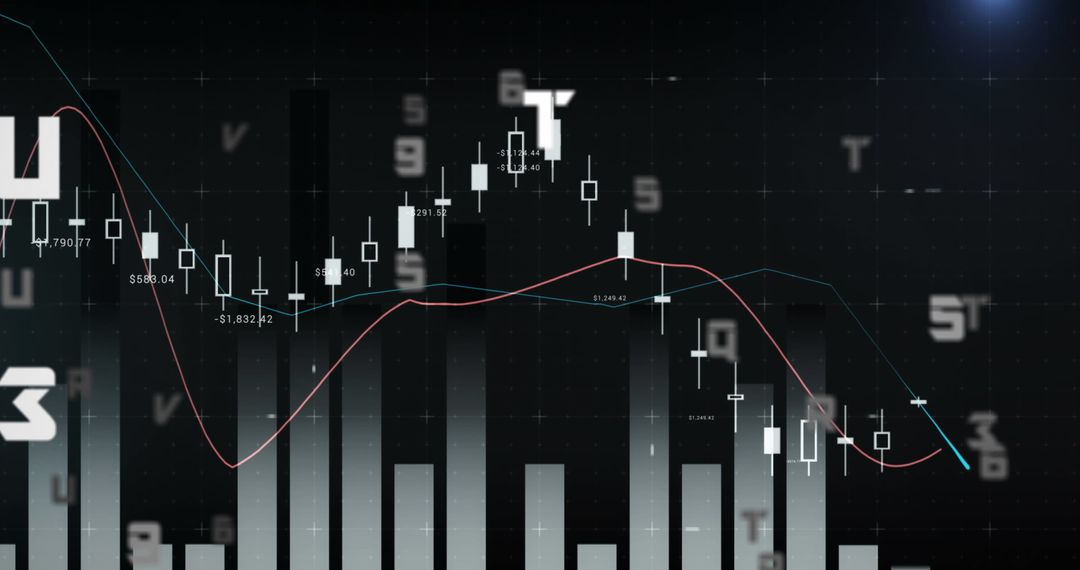
Illustrates advanced financial graphs and data overlays on digital interface, reflecting trends and patterns used for market analysis and predictions. Useful for presentations related to economics, business strategy, and trading education.
Powered by 


16
downloads
downloads
Tags:
More
Credit Photo
If you would like to credit the Photo, here are some ways you can do so
Text Link
photo Link
<span class="text-link">
<span>
<a target="_blank" href=https://pikwizard.com/photo/financial-graphs-and-charts-on-digital-interface/83cab266175f8e442f1d7200d6f63544/>PikWizard</a>
</span>
</span>
<span class="image-link">
<span
style="margin: 0 0 20px 0; display: inline-block; vertical-align: middle; width: 100%;"
>
<a
target="_blank"
href="https://pikwizard.com/photo/financial-graphs-and-charts-on-digital-interface/83cab266175f8e442f1d7200d6f63544/"
style="text-decoration: none; font-size: 10px; margin: 0;"
>
<img src="https://pikwizard.com/pw/medium/83cab266175f8e442f1d7200d6f63544.jpg" style="margin: 0; width: 100%;" alt="" />
<p style="font-size: 12px; margin: 0;">PikWizard</p>
</a>
</span>
</span>
Free (free of charge)
Free for personal and commercial use.
Author: Awesome Content
Similar Free Stock Images

Premium


Premium


Premium


Premium


Premium


Premium


Premium


Premium


Premium


Premium


Premium


Premium


Premium


Premium


Premium


Premium


Premium


Premium


Premium


Premium


Premium


Premium


Premium


Premium