
- Home >
- Stock Photos >
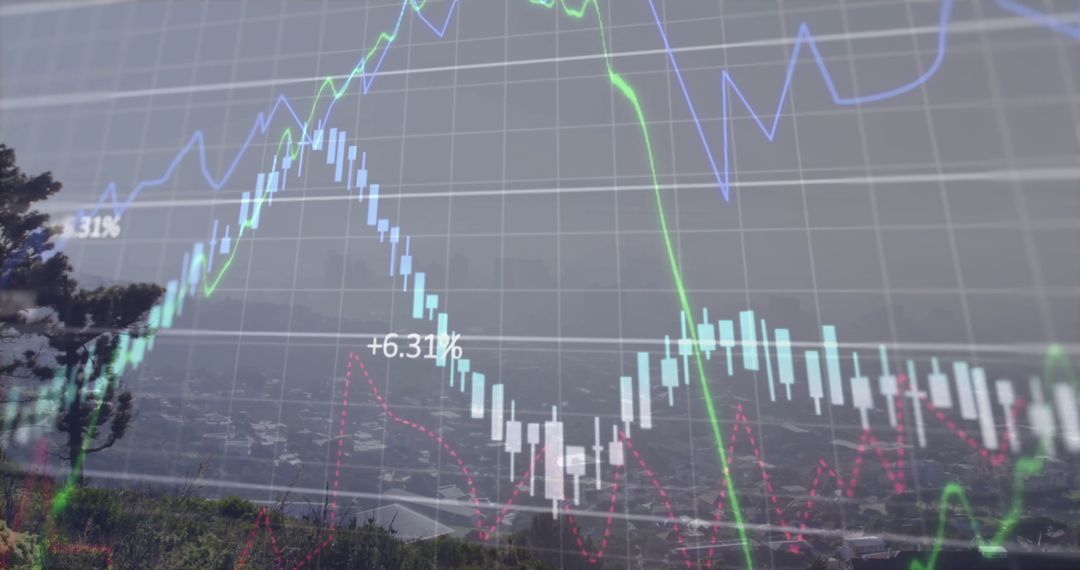
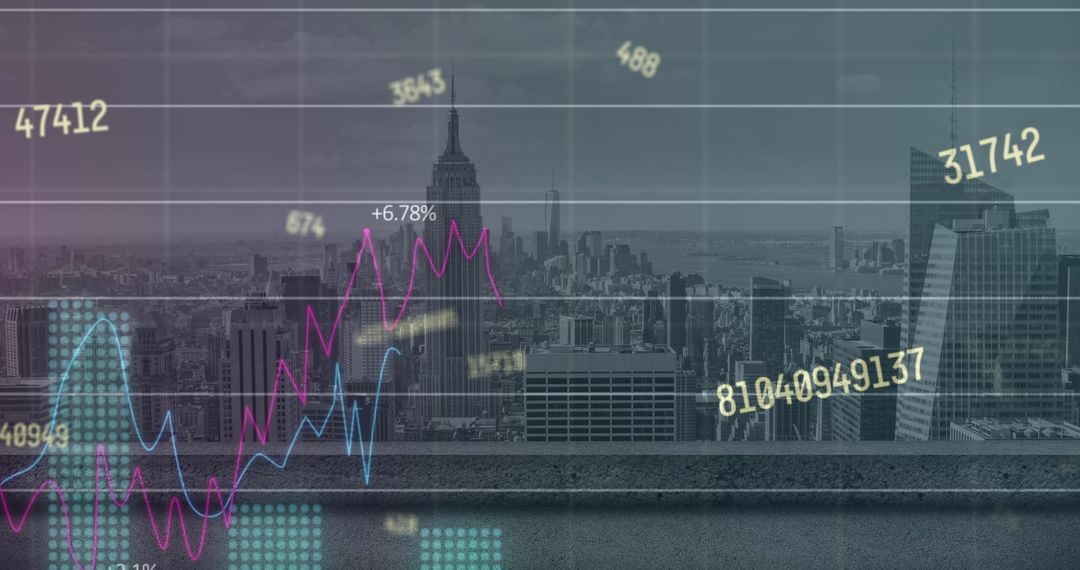
- Financial Graphs and Cityscape Merging Conceptualizing Economy
Financial Graphs and Cityscape Merging Conceptualizing Economy Image

Picture displaying overlay of financial graphs against skyline representing integration of reliable data analysis with urban settings. Ideal for illustrating business articles, technology-escalating economic research, trend analysis in financial presentations, and global economic forecasts within corporate media.
Powered by 


2
downloads
downloads
Tags:
More
Credit Photo
If you would like to credit the Photo, here are some ways you can do so
Text Link
photo Link
<span class="text-link">
<span>
<a target="_blank" href=https://pikwizard.com/photo/financial-graphs-and-cityscape-merging-conceptualizing-economy/376d5d0c222dd3a5431e1f780d266090/>PikWizard</a>
</span>
</span>
<span class="image-link">
<span
style="margin: 0 0 20px 0; display: inline-block; vertical-align: middle; width: 100%;"
>
<a
target="_blank"
href="https://pikwizard.com/photo/financial-graphs-and-cityscape-merging-conceptualizing-economy/376d5d0c222dd3a5431e1f780d266090/"
style="text-decoration: none; font-size: 10px; margin: 0;"
>
<img src="https://pikwizard.com/pw/medium/376d5d0c222dd3a5431e1f780d266090.jpg" style="margin: 0; width: 100%;" alt="" />
<p style="font-size: 12px; margin: 0;">PikWizard</p>
</a>
</span>
</span>
Free (free of charge)
Free for personal and commercial use.
Author: Creative Art
Similar Free Stock Images

Premium


Premium


Premium


Premium


Premium


Premium


Premium


Premium


Premium


Premium


Premium


Premium


Premium


Premium


Premium


Premium


Premium


Premium


Premium


Premium


Premium


Premium


Premium


Premium

