
- Home >
- Stock Photos >
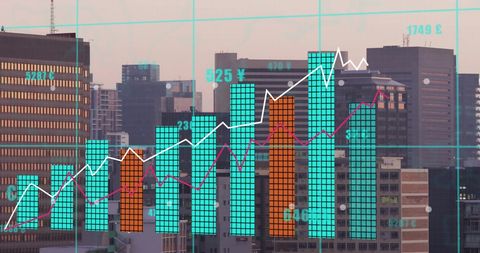
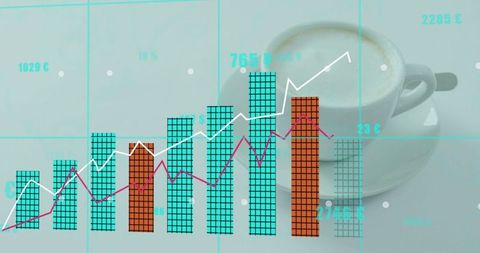
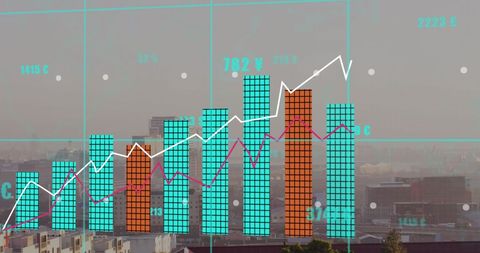
- Financial Graphs and Data Overlapping Office Background
Financial Graphs and Data Overlapping Office Background Image

Dynamic abstraction of financial graphs with real-time data projections on office backdrop, suitable for financial reports, business presentations, or educational materials emphasizing data analysis, modern technology trends, and economic indicators.
Powered by 


downloads
Tags:
More
Credit Photo
If you would like to credit the Photo, here are some ways you can do so
Text Link
photo Link
<span class="text-link">
<span>
<a target="_blank" href=https://pikwizard.com/photo/financial-graphs-and-data-overlapping-office-background/f3f37f004516bf0c7632f5fab510d91e/>PikWizard</a>
</span>
</span>
<span class="image-link">
<span
style="margin: 0 0 20px 0; display: inline-block; vertical-align: middle; width: 100%;"
>
<a
target="_blank"
href="https://pikwizard.com/photo/financial-graphs-and-data-overlapping-office-background/f3f37f004516bf0c7632f5fab510d91e/"
style="text-decoration: none; font-size: 10px; margin: 0;"
>
<img src="https://pikwizard.com/pw/medium/f3f37f004516bf0c7632f5fab510d91e.jpg" style="margin: 0; width: 100%;" alt="" />
<p style="font-size: 12px; margin: 0;">PikWizard</p>
</a>
</span>
</span>
Free (free of charge)
Free for personal and commercial use.
Author: People Creations
Similar Free Stock Images

Premium


Premium


Premium


Premium


Premium


Premium


Premium


Premium

Premium


Premium


Premium

Premium


Premium


Premium

Premium


Premium


Premium


Premium


Premium


Premium


Premium


Premium


Premium


Premium


Premium


Explore More Free Stock Images