
- Home >
- Stock Photos >
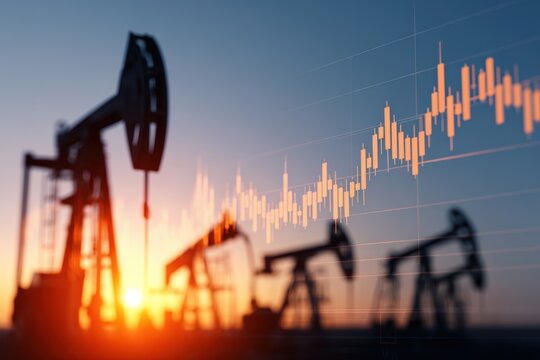
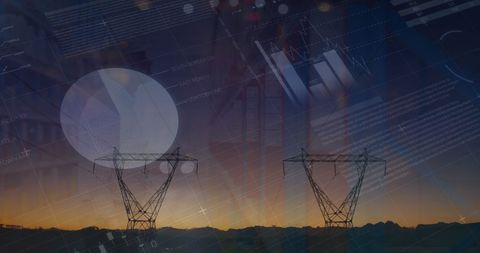
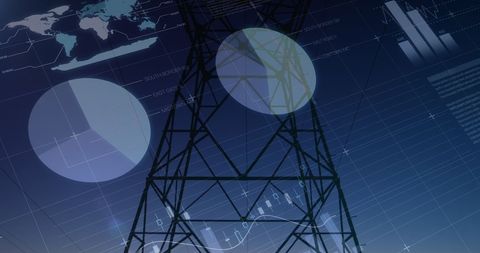
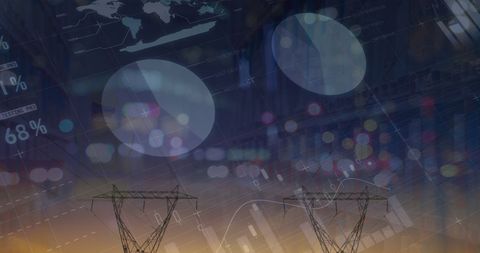
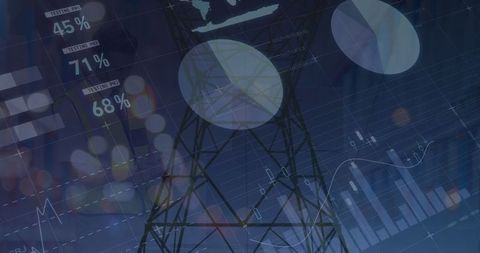
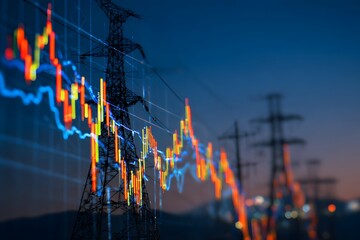
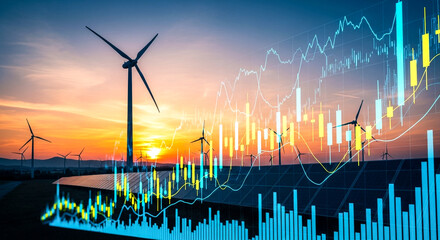
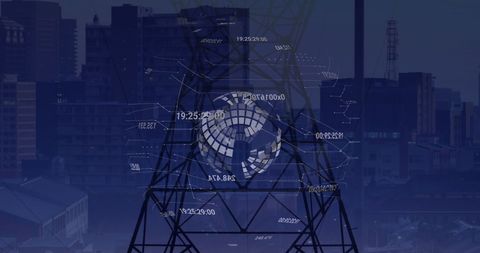
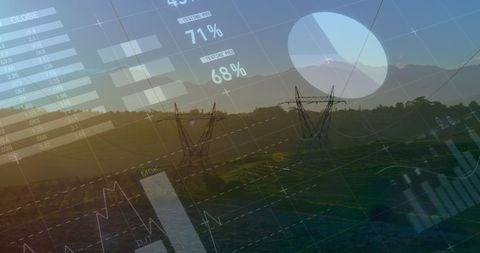
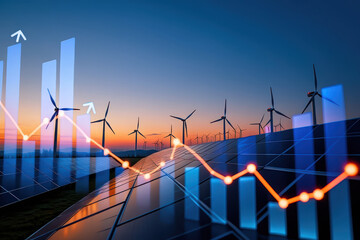
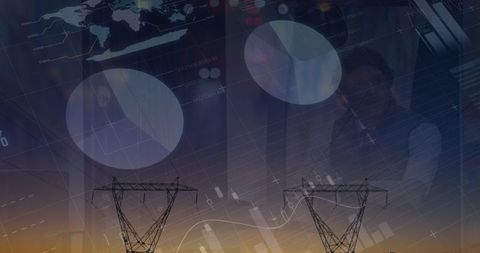
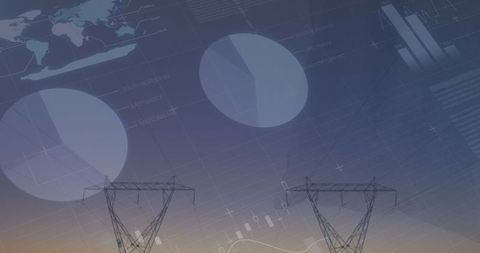
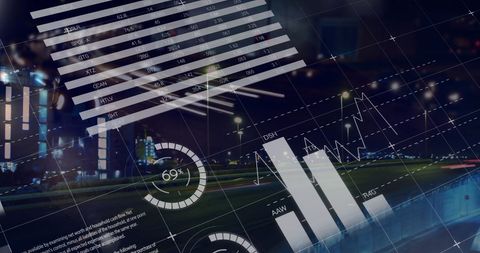
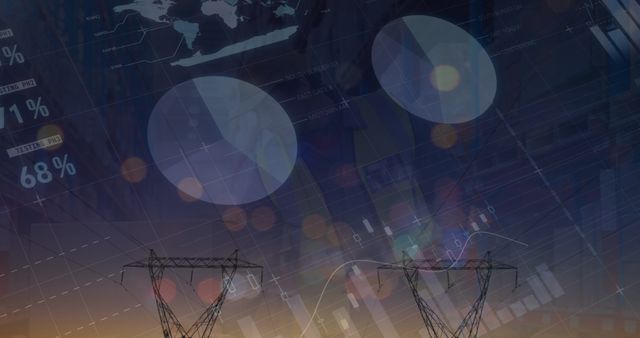
- Financial Graphs and Power Lines Symbolizing Energy Economics
Financial Graphs and Power Lines Symbolizing Energy Economics Image

Multiple layered dashboards show financial graphs and energy statistics overlaid with power lines at dusk, indicating a mix of electricity consumption and economic performance. Useful for illustrations on energy economics, market finance, and technological innovation.
Powered by 


downloads
Tags:
More
Credit Photo
If you would like to credit the Photo, here are some ways you can do so
Text Link
photo Link
<span class="text-link">
<span>
<a target="_blank" href=https://pikwizard.com/photo/financial-graphs-and-power-lines-symbolizing-energy-economics/22eeffe923ae696f34a2df22792ce313/>PikWizard</a>
</span>
</span>
<span class="image-link">
<span
style="margin: 0 0 20px 0; display: inline-block; vertical-align: middle; width: 100%;"
>
<a
target="_blank"
href="https://pikwizard.com/photo/financial-graphs-and-power-lines-symbolizing-energy-economics/22eeffe923ae696f34a2df22792ce313/"
style="text-decoration: none; font-size: 10px; margin: 0;"
>
<img src="https://pikwizard.com/pw/medium/22eeffe923ae696f34a2df22792ce313.jpg" style="margin: 0; width: 100%;" alt="" />
<p style="font-size: 12px; margin: 0;">PikWizard</p>
</a>
</span>
</span>
Free (free of charge)
Free for personal and commercial use.
Author: People Creations
Similar Free Stock Images
Loading...

Premium


Premium


Premium


Premium


Premium


Premium


Premium


Premium


Premium


Premium


Premium


Premium


Premium
Premium


Premium


Premium


Premium


Premium


Premium

Premium


Premium


Premium


Premium


Premium


Premium


Explore More Free Stock Images