
- Home >
- Stock Photos >
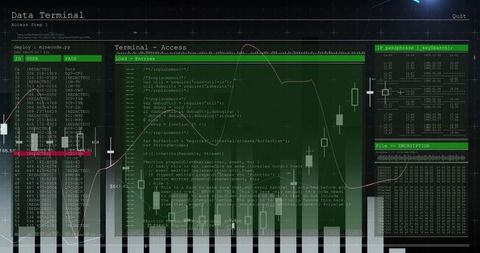
- Financial Graphs and Programming Code Overlay
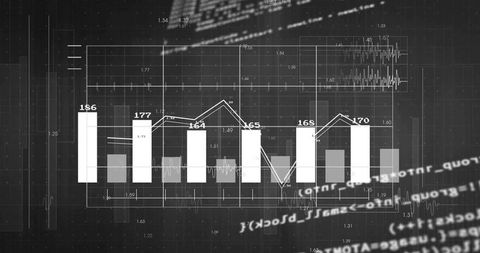
Financial Graphs and Programming Code Overlay Image

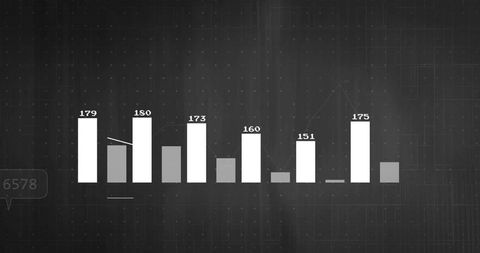
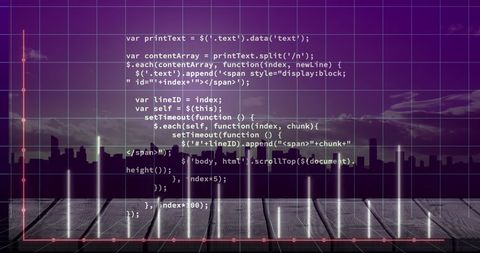
Intricate overlay of bar and line graphs on green programming code symbolizes integration of financial data and technological analytics. Perfect for illustrating complex data analysis, technological advancement in finance, or software-related statistical growth. Ideal for presentations on data processing, fintech solutions, or IT-driven economic insights.
Powered by  - Get 15% off with code: PIKWIZARD15


downloads
Tags:
More
Credit Photo
If you would like to credit the Photo, here are some ways you can do so
Text Link
photo Link
<span class="text-link">
<span>
<a target="_blank" href=https://pikwizard.com/photo/financial-graphs-and-programming-code-overlay/f6b6ae5a7f839e6fa7bd2092288071d3/>PikWizard</a>
</span>
</span>
<span class="image-link">
<span
style="margin: 0 0 20px 0; display: inline-block; vertical-align: middle; width: 100%;"
>
<a
target="_blank"
href="https://pikwizard.com/photo/financial-graphs-and-programming-code-overlay/f6b6ae5a7f839e6fa7bd2092288071d3/"
style="text-decoration: none; font-size: 10px; margin: 0;"
>
<img src="https://pikwizard.com/pw/medium/f6b6ae5a7f839e6fa7bd2092288071d3.jpg" style="margin: 0; width: 100%;" alt="" />
<p style="font-size: 12px; margin: 0;">PikWizard</p>
</a>
</span>
</span>
Free (free of charge)
Free for personal and commercial use.
Author: Creative Art
Similar Free Stock Images

Premium


Premium


Premium

Premium

Premium

Premium


Premium

Premium

Premium

Premium


Premium


Premium

Premium

Premium


Premium

Premium


Premium


Premium


Premium


Premium

Premium

Premium


Premium

Premium

Premium


Explore More Free Stock Images