- Home >
- Stock Photos >
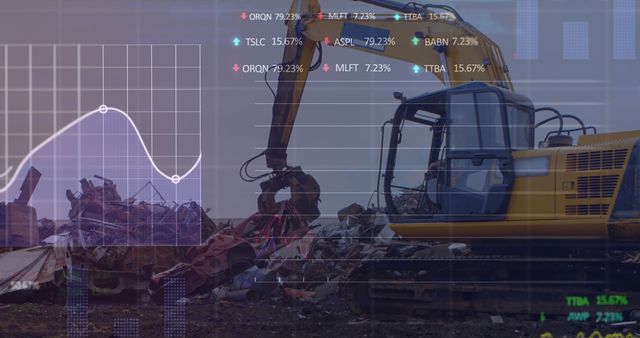
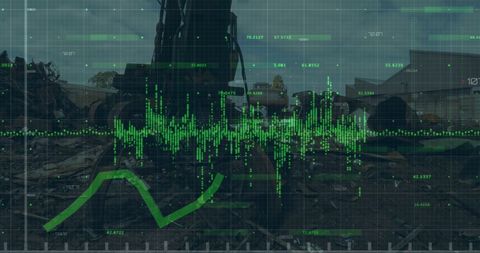
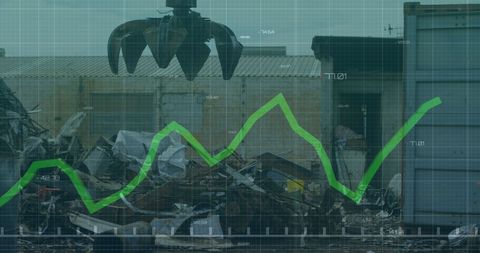
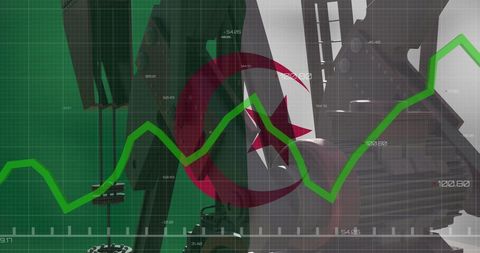
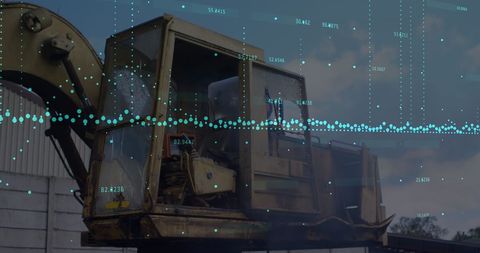
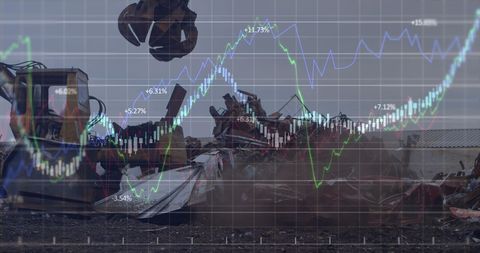
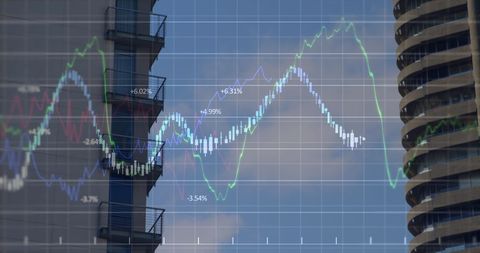
- Financial Graphs Merging with Industrial Machinery
Financial Graphs Merging with Industrial Machinery Image

Visual illustrating concepts of finance and industry, combining market data graphics with images of machinery in a junkyard setting. Suitable for use in articles or presentations about economic analysis of recycling and waste management industries, technological advancements in recycling or blending economic forecasts with industrial operations context.
Powered by 


2
downloads
downloads
Tags:
More
Credit Photo
If you would like to credit the Photo, here are some ways you can do so
Text Link
photo Link
<span class="text-link">
<span>
<a target="_blank" href=https://pikwizard.com/photo/financial-graphs-merging-with-industrial-machinery/7ff3bcdf6b956148ec9b1d211461bde6/>PikWizard</a>
</span>
</span>
<span class="image-link">
<span
style="margin: 0 0 20px 0; display: inline-block; vertical-align: middle; width: 100%;"
>
<a
target="_blank"
href="https://pikwizard.com/photo/financial-graphs-merging-with-industrial-machinery/7ff3bcdf6b956148ec9b1d211461bde6/"
style="text-decoration: none; font-size: 10px; margin: 0;"
>
<img src="https://pikwizard.com/pw/medium/7ff3bcdf6b956148ec9b1d211461bde6.jpg" style="margin: 0; width: 100%;" alt="" />
<p style="font-size: 12px; margin: 0;">PikWizard</p>
</a>
</span>
</span>
Free (free of charge)
Free for personal and commercial use.
Author: Awesome Content
Similar Free Stock Images
Loading...

Premium


Premium


Premium


Premium

Premium


Premium


Premium


Premium


Premium

Premium


Premium


Premium


Premium

Premium


Premium


Premium


Premium


Premium


Premium


Premium

Premium
Premium


Premium


Premium

Premium