- Home >
- Stock Photos >
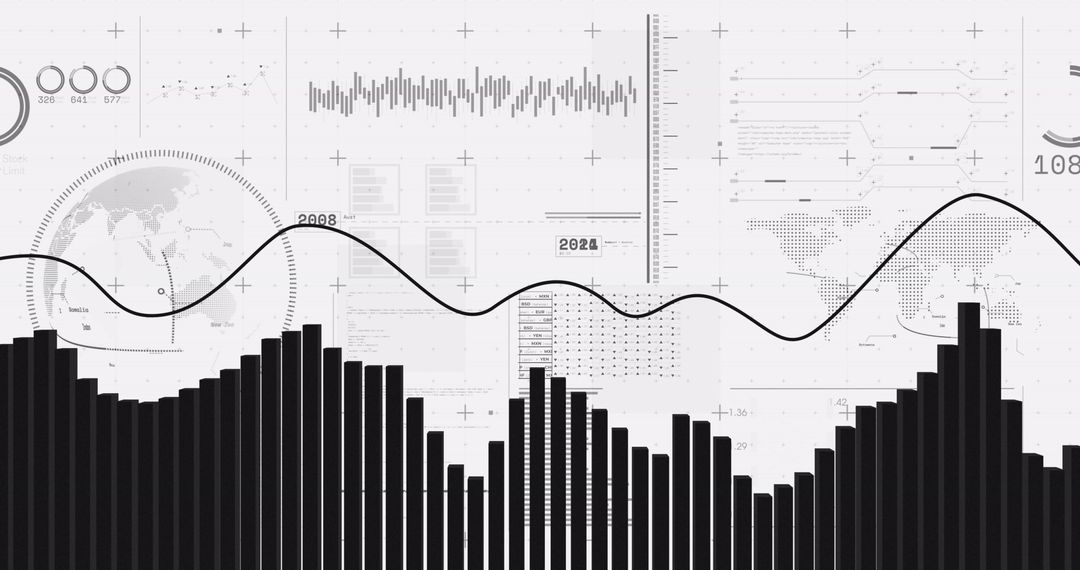
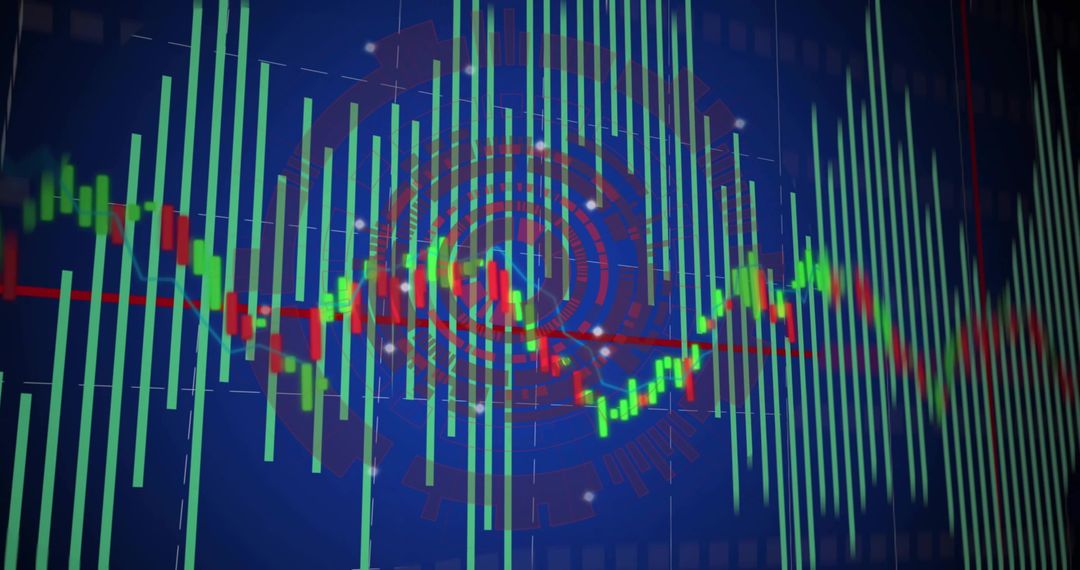
- Financial Graphs Over Candlestick Chart Indicating Stock Fluctuations
Financial Graphs Over Candlestick Chart Indicating Stock Fluctuations Image

Illustrates complexity of financial markets through overlapping graphs and charts, ideal for finance blogs or promotional material for trading platform. Visualizes stock trading, data science, market patterns for presentations or educational content.
Powered by  - Get 15% off with code: PIKWIZARD15


2
downloads
downloads
Tags:
More
Credit Photo
If you would like to credit the Photo, here are some ways you can do so
Text Link
photo Link
<span class="text-link">
<span>
<a target="_blank" href=https://pikwizard.com/photo/financial-graphs-over-candlestick-chart-indicating-stock-fluctuations/b20e55e1b114d29ff6cd87136795d2d2/>PikWizard</a>
</span>
</span>
<span class="image-link">
<span
style="margin: 0 0 20px 0; display: inline-block; vertical-align: middle; width: 100%;"
>
<a
target="_blank"
href="https://pikwizard.com/photo/financial-graphs-over-candlestick-chart-indicating-stock-fluctuations/b20e55e1b114d29ff6cd87136795d2d2/"
style="text-decoration: none; font-size: 10px; margin: 0;"
>
<img src="https://pikwizard.com/pw/medium/b20e55e1b114d29ff6cd87136795d2d2.jpg" style="margin: 0; width: 100%;" alt="" />
<p style="font-size: 12px; margin: 0;">PikWizard</p>
</a>
</span>
</span>
Free (free of charge)
Free for personal and commercial use.
Author: Creative Art
Similar Free Stock Images

Premium


Premium


Premium


Premium


Premium


Premium


Premium


Premium


Premium


Premium


Premium


Premium


Premium


Premium


Premium


Premium


Premium


Premium


Premium


Premium


Premium


Premium


Premium


Premium