
- Home >
- Stock Photos >
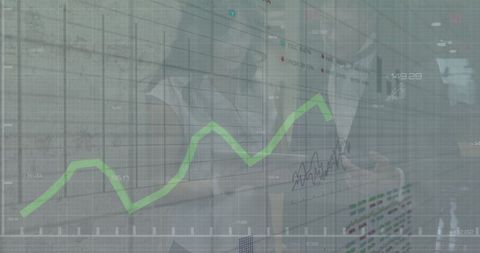
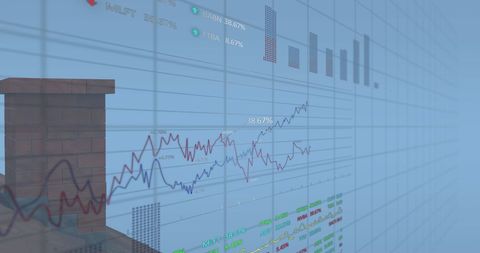
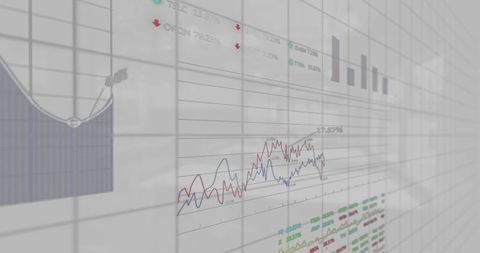
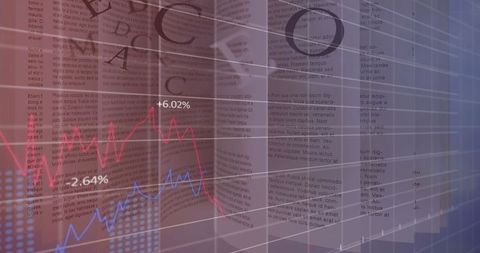
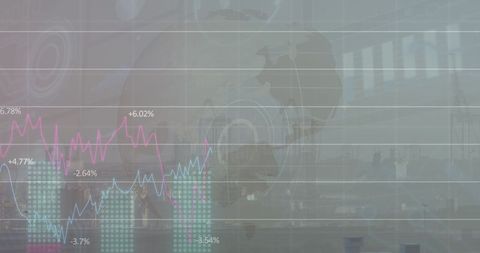
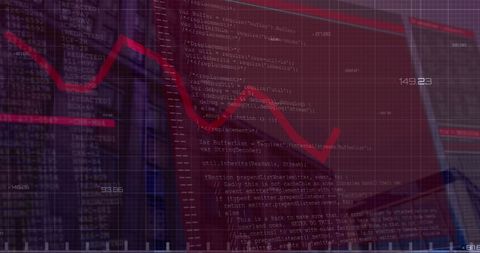
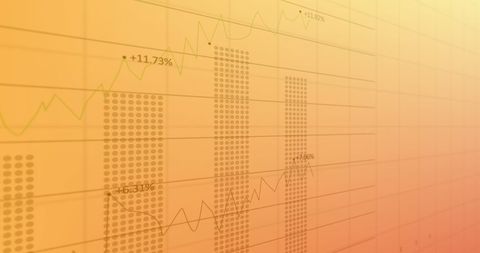
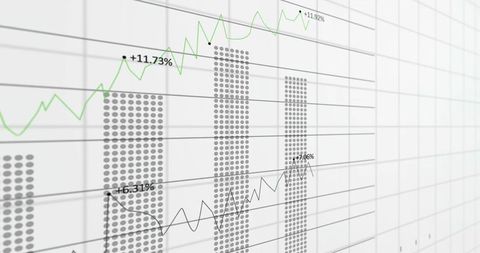
- Financial Graphs Overlaid on Text Symbolizing Data Analysis
Financial Graphs Overlaid on Text Symbolizing Data Analysis Image

Visual representing a blend of financial graphs and text pages symbolizes the intersection of data analysis and literature or information. Useful for illustrating articles on financial trends, analytic strategies, or technological impact on business documentation.
Powered by  - Get 15% off with code: PIKWIZARD15


downloads
Tags:
More
Credit Photo
If you would like to credit the Photo, here are some ways you can do so
Text Link
photo Link
<span class="text-link">
<span>
<a target="_blank" href=https://pikwizard.com/photo/financial-graphs-overlaid-on-text-symbolizing-data-analysis/46b8a8b644732057e223bcfcb475330d/>PikWizard</a>
</span>
</span>
<span class="image-link">
<span
style="margin: 0 0 20px 0; display: inline-block; vertical-align: middle; width: 100%;"
>
<a
target="_blank"
href="https://pikwizard.com/photo/financial-graphs-overlaid-on-text-symbolizing-data-analysis/46b8a8b644732057e223bcfcb475330d/"
style="text-decoration: none; font-size: 10px; margin: 0;"
>
<img src="https://pikwizard.com/pw/medium/46b8a8b644732057e223bcfcb475330d.jpg" style="margin: 0; width: 100%;" alt="" />
<p style="font-size: 12px; margin: 0;">PikWizard</p>
</a>
</span>
</span>
Free (free of charge)
Free for personal and commercial use.
Author: Creative Art
Similar Free Stock Images

Premium


Premium


Premium


Premium


Premium

Premium


Premium

Premium


Premium


Premium


Premium


Premium


Premium


Premium


Premium


Premium


Premium


Premium


Premium


Premium


Premium


Premium


Premium

Premium

Premium

Explore More Free Stock Images