
- Home >
- Stock Photos >
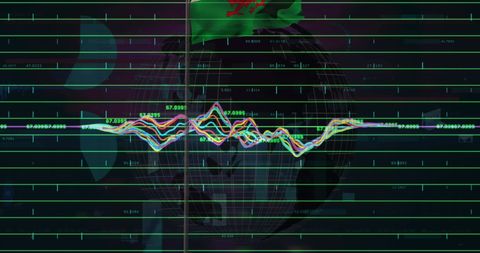
- Financial Graphs with Globally Inspired Data Visualization
Financial Graphs with Globally Inspired Data Visualization Image

This vibrant depiction of financial data intertwined with a globe background offers visual insights into global finance and economy landscapes. It is perfect for use in presentations and publications related to business analytics, investment strategies, and economic studies to enhance the discussion on financial trends and international markets.
Powered by 


downloads
Tags:
More
Credit Photo
If you would like to credit the Photo, here are some ways you can do so
Text Link
photo Link
<span class="text-link">
<span>
<a target="_blank" href=https://pikwizard.com/photo/financial-graphs-with-globally-inspired-data-visualization/0dc5f8746fa87b829f7992c1c34fcf4c/>PikWizard</a>
</span>
</span>
<span class="image-link">
<span
style="margin: 0 0 20px 0; display: inline-block; vertical-align: middle; width: 100%;"
>
<a
target="_blank"
href="https://pikwizard.com/photo/financial-graphs-with-globally-inspired-data-visualization/0dc5f8746fa87b829f7992c1c34fcf4c/"
style="text-decoration: none; font-size: 10px; margin: 0;"
>
<img src="https://pikwizard.com/pw/medium/0dc5f8746fa87b829f7992c1c34fcf4c.jpg" style="margin: 0; width: 100%;" alt="" />
<p style="font-size: 12px; margin: 0;">PikWizard</p>
</a>
</span>
</span>
Free (free of charge)
Free for personal and commercial use.
Author: People Creations
Similar Free Stock Images

Premium


Premium


Premium


Premium


Premium


Premium


Premium

Premium

Premium

Premium


Premium


Premium


Premium


Premium

Premium

Premium


Premium


Premium


Premium

Premium


Premium


Premium


Premium


Premium


Premium


Explore More Free Stock Images