- Home >
- Stock Photos >
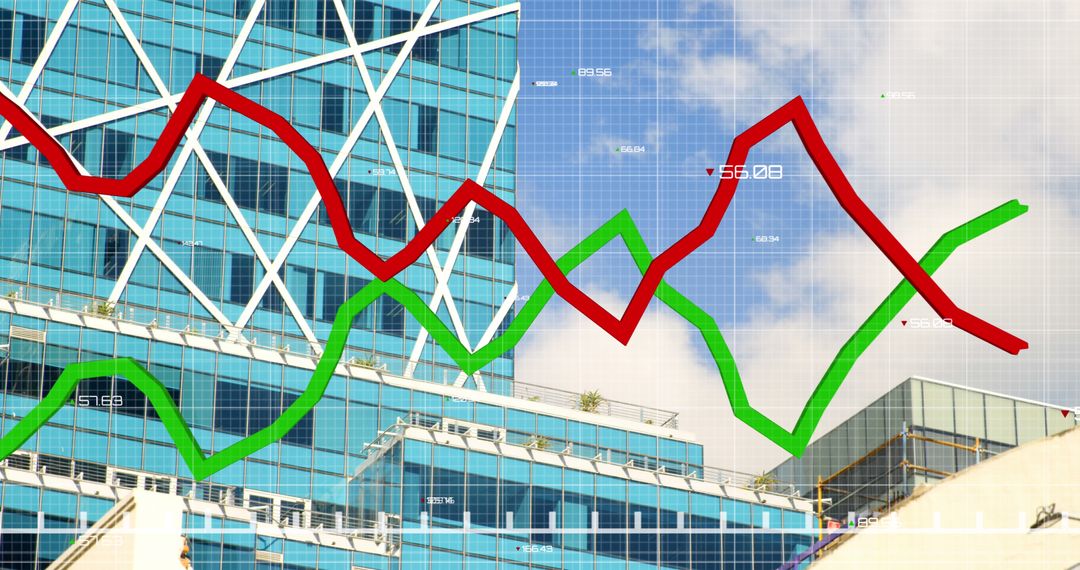
- Financial Growth Algorithms Over City View with Green and Red Lines
Financial Growth Algorithms Over City View with Green and Red Lines Image
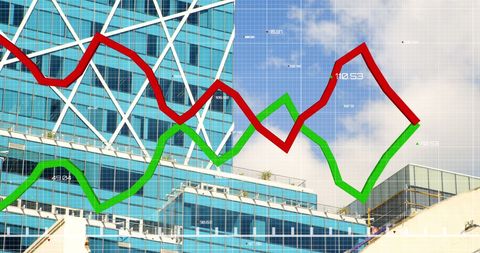
Financial growth algorithms are illustrated with dynamic red and green lines against a backdrop of a modern building, suggesting connections between market trends and urban development. Useful for business finance presentations, economic analysis reports, or investment company marketing. The contrast of bold colors with the sleek building design emphasizes global financial dynamics.
Powered by  - Get 15% off with code: PIKWIZARD15


2
downloads
downloads
Tags:
More
Credit Photo
If you would like to credit the Photo, here are some ways you can do so
Text Link
photo Link
<span class="text-link">
<span>
<a target="_blank" href=https://pikwizard.com/photo/financial-growth-algorithms-over-city-view-with-green-and-red-lines/bf2855ebda5a7e944a793c3a22cbdffe/>PikWizard</a>
</span>
</span>
<span class="image-link">
<span
style="margin: 0 0 20px 0; display: inline-block; vertical-align: middle; width: 100%;"
>
<a
target="_blank"
href="https://pikwizard.com/photo/financial-growth-algorithms-over-city-view-with-green-and-red-lines/bf2855ebda5a7e944a793c3a22cbdffe/"
style="text-decoration: none; font-size: 10px; margin: 0;"
>
<img src="https://pikwizard.com/pw/medium/bf2855ebda5a7e944a793c3a22cbdffe.jpg" style="margin: 0; width: 100%;" alt="" />
<p style="font-size: 12px; margin: 0;">PikWizard</p>
</a>
</span>
</span>
Free (free of charge)
Free for personal and commercial use.
Author: People Creations
Similar Free Stock Images

Premium


Premium


Premium


Premium


Premium


Premium


Premium


Premium


Premium


Premium


Premium


Premium


Premium


Premium


Premium


Premium


Premium


Premium


Premium


Premium


Premium


Premium


Premium


Premium