- Home >
- Stock Photos >
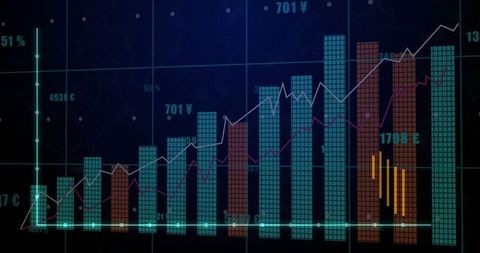
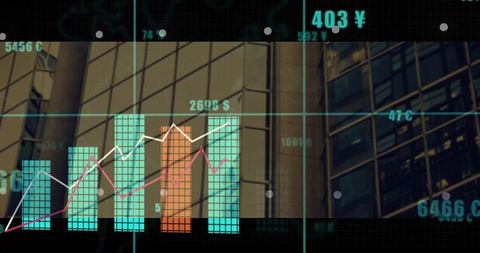
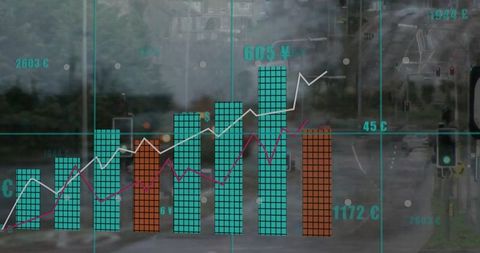
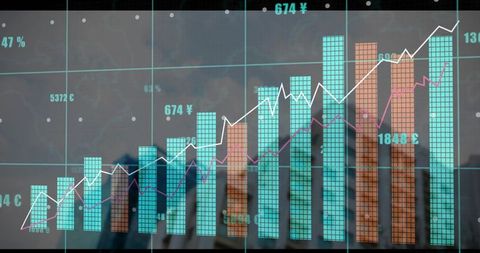
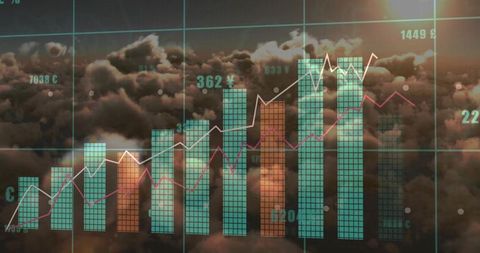
- Financial Growth Chart with Currency Symbols on Natural Texture
Financial Growth Chart with Currency Symbols on Natural Texture Image
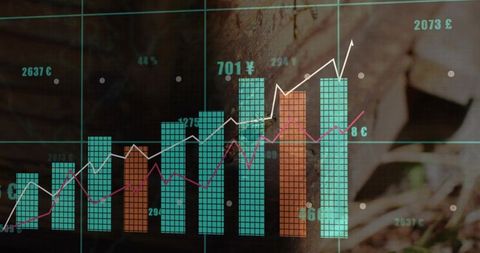
Combining financial metrics with a natural wood texture suggests sustainable growth. Images like this are perfect for financial reports, presentations focusing on ecology or sustainability, and modern analytics platforms. They reflect both ecological mindfulness and robust financial strategy.
Powered by  - Get 15% off with code: PIKWIZARD15


0
downloads
downloads
Tags:
More
Credit Photo
If you would like to credit the Photo, here are some ways you can do so
Text Link
photo Link
<span class="text-link">
<span>
<a target="_blank" href=https://pikwizard.com/photo/financial-growth-chart-with-currency-symbols-on-natural-texture/748aae356b82482c4e946d2f87f5bb38/>PikWizard</a>
</span>
</span>
<span class="image-link">
<span
style="margin: 0 0 20px 0; display: inline-block; vertical-align: middle; width: 100%;"
>
<a
target="_blank"
href="https://pikwizard.com/photo/financial-growth-chart-with-currency-symbols-on-natural-texture/748aae356b82482c4e946d2f87f5bb38/"
style="text-decoration: none; font-size: 10px; margin: 0;"
>
<img src="https://pikwizard.com/pw/medium/748aae356b82482c4e946d2f87f5bb38.jpg" style="margin: 0; width: 100%;" alt="" />
<p style="font-size: 12px; margin: 0;">PikWizard</p>
</a>
</span>
</span>
Free (free of charge)
Free for personal and commercial use.
Author: Awesome Content
Similar Free Stock Images
Loading...

Premium


Premium


Premium


Premium


Premium

Premium


Premium


Premium

Premium


Premium


Premium


Premium

Premium


Premium


Premium


Premium


Premium

Premium


Premium


Premium


Premium


Premium


Premium


Premium


Premium