
- Home >
- Stock Photos >
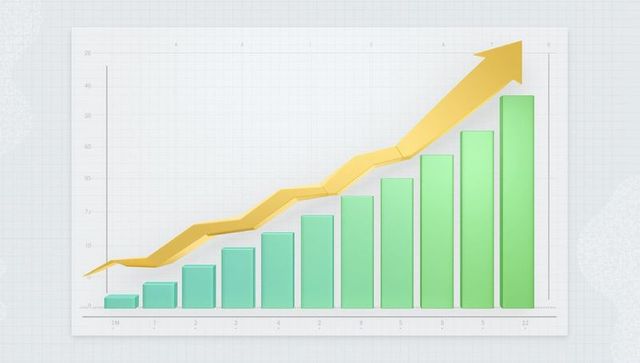
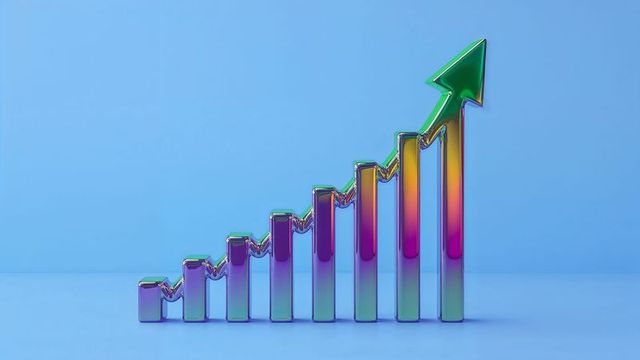
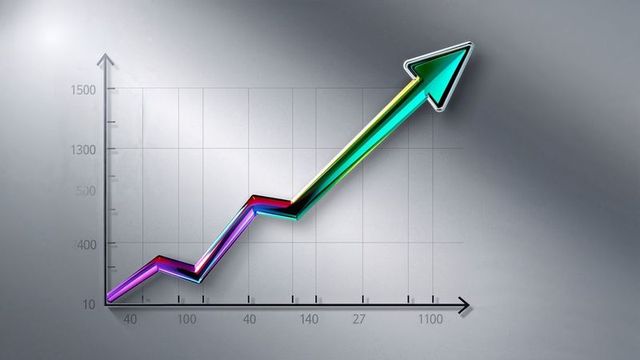
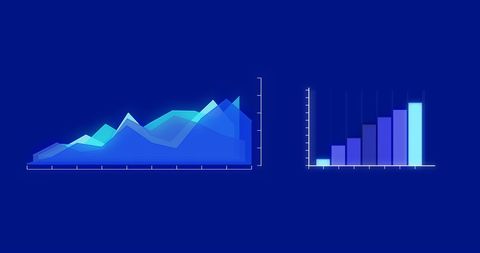
- Financial Growth Chart with Increasing Trends
Financial Growth Chart with Increasing Trends Image
AI
AI Generated Image. Illustration showcasing a combination of a bar and line chart, highlighting significant financial growth with a prominent gold arrow. Grid axes and data points convey clear representation of data trends. Useful for finance, business presentations, educational infographics, and reports on economic performance and forecasting.

downloads
Tags:
More
Credit Photo
If you would like to credit the Photo, here are some ways you can do so
Text Link
photo Link
<span class="text-link">
<span>
<a target="_blank" href=https://pikwizard.com/photo/financial-growth-chart-with-increasing-trends/b3c6ca15f8a4f38ec756571e97f3b2ee/>PikWizard</a>
</span>
</span>
<span class="image-link">
<span
style="margin: 0 0 20px 0; display: inline-block; vertical-align: middle; width: 100%;"
>
<a
target="_blank"
href="https://pikwizard.com/photo/financial-growth-chart-with-increasing-trends/b3c6ca15f8a4f38ec756571e97f3b2ee/"
style="text-decoration: none; font-size: 10px; margin: 0;"
>
<img src="https://pikwizard.com/pw/medium/b3c6ca15f8a4f38ec756571e97f3b2ee.jpg" style="margin: 0; width: 100%;" alt="" />
<p style="font-size: 12px; margin: 0;">PikWizard</p>
</a>
</span>
</span>
Free (free of charge)
Free for personal and commercial use.
Author: AI Creator
Similar Free Stock Images


AI


AI


AI


AI


AI


AI
AI


AI


AI


AI


Explore More Free Stock Images