- Home >
- Stock Photos >
- Financial Growth Chart with Stacked Dollar Bills Outline
Financial Growth Chart with Stacked Dollar Bills Outline Image
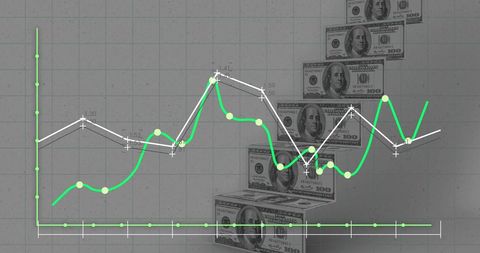
Image shows a graph illustrating financial trends placed over stacked hundred-dollar bills. Vivid green and white lines depict data progression, symbolizing investment returns or stock market fluctuations. Useful for presentations, business reports, financial consulting, and economic forecasts to provide a visual representation of market dynamics and currency implications.
Powered by  - Get 15% off with code: PIKWIZARD15


2
downloads
downloads
Tags:
More
Credit Photo
If you would like to credit the Photo, here are some ways you can do so
Text Link
photo Link
<span class="text-link">
<span>
<a target="_blank" href=https://pikwizard.com/photo/financial-growth-chart-with-stacked-dollar-bills-outline/06398de730afb7e9cbceb61803c58bd3/>PikWizard</a>
</span>
</span>
<span class="image-link">
<span
style="margin: 0 0 20px 0; display: inline-block; vertical-align: middle; width: 100%;"
>
<a
target="_blank"
href="https://pikwizard.com/photo/financial-growth-chart-with-stacked-dollar-bills-outline/06398de730afb7e9cbceb61803c58bd3/"
style="text-decoration: none; font-size: 10px; margin: 0;"
>
<img src="https://pikwizard.com/pw/medium/06398de730afb7e9cbceb61803c58bd3.jpg" style="margin: 0; width: 100%;" alt="" />
<p style="font-size: 12px; margin: 0;">PikWizard</p>
</a>
</span>
</span>
Free (free of charge)
Free for personal and commercial use.
Author: People Creations
Similar Free Stock Images
Loading...

Premium


Premium


Premium


Premium


Premium


Premium


Premium

Premium


Premium


Premium


Premium

Premium

Premium


Premium


Premium

Premium


Premium

Premium

Premium

Premium

Premium


Premium


Premium

Premium

Premium