- Home >
- Stock Photos >
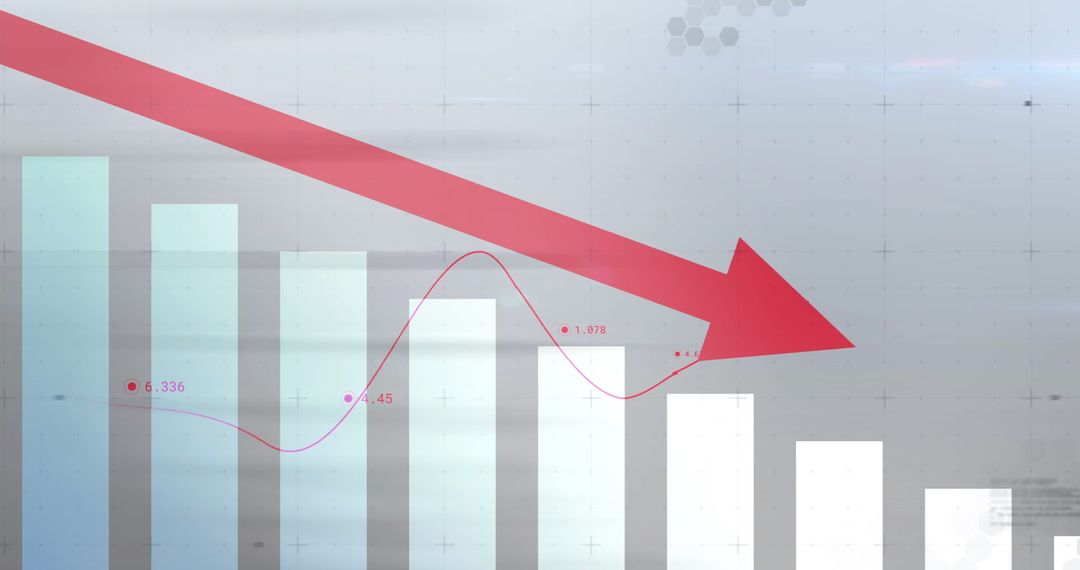
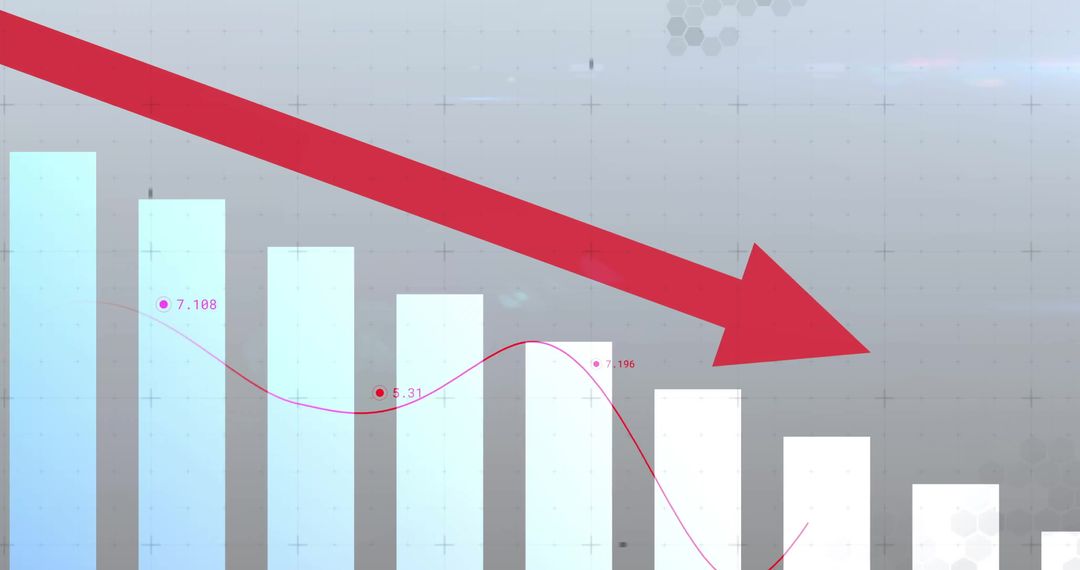
- Financial Growth Chart with Upward Arrow and Data Points
Financial Growth Chart with Upward Arrow and Data Points Image

Depiction of a vibrant financial graph with a distinctive upward arrow symbol, showcasing the concept of economic growth and success. Blue bars and plotted points visually represent statistical data in a digital format. Ideal for use in business presentations, financial forecasts, or reports highlighting positive trends and analytical success.
Powered by  - Get 15% off with code: PIKWIZARD15


0
downloads
downloads
Tags:
More
Credit Photo
If you would like to credit the Photo, here are some ways you can do so
Text Link
photo Link
<span class="text-link">
<span>
<a target="_blank" href=https://pikwizard.com/photo/financial-growth-chart-with-upward-arrow-and-data-points/17cdb7fe68f8acc598c49ea2eb403349/>PikWizard</a>
</span>
</span>
<span class="image-link">
<span
style="margin: 0 0 20px 0; display: inline-block; vertical-align: middle; width: 100%;"
>
<a
target="_blank"
href="https://pikwizard.com/photo/financial-growth-chart-with-upward-arrow-and-data-points/17cdb7fe68f8acc598c49ea2eb403349/"
style="text-decoration: none; font-size: 10px; margin: 0;"
>
<img src="https://pikwizard.com/pw/medium/17cdb7fe68f8acc598c49ea2eb403349.jpg" style="margin: 0; width: 100%;" alt="" />
<p style="font-size: 12px; margin: 0;">PikWizard</p>
</a>
</span>
</span>
Free (free of charge)
Free for personal and commercial use.
Author: Awesome Content
Similar Free Stock Images

Premium


Premium


Premium


Premium


Premium


Premium


Premium


Premium


Premium


Premium


Premium


Premium


Premium


Premium


Premium


Premium


Premium


Premium


Premium


Premium


Premium


Premium


Premium


Premium