- Home >
- Stock Photos >
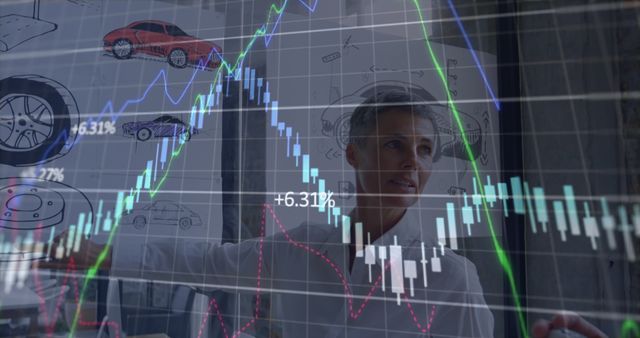
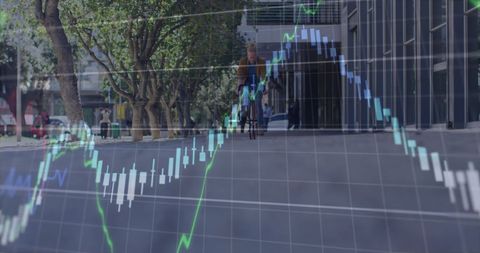
- Financial Growth Graphs Over Junkyard Machines
Financial Growth Graphs Over Junkyard Machines Image

Overlay of financial data on junkyard machinery symbolizes intersection of economy and sustainability. Suitable for illustrating concepts like recycling's economic impact, market trends in waste management. Great for eco-friendly investment articles and presentations.
Powered by 


2
downloads
downloads
Tags:
More
Credit Photo
If you would like to credit the Photo, here are some ways you can do so
Text Link
photo Link
<span class="text-link">
<span>
<a target="_blank" href=https://pikwizard.com/photo/financial-growth-graphs-over-junkyard-machines/d6b8a8b98ff88b3956efd1db76a1f7a6/>PikWizard</a>
</span>
</span>
<span class="image-link">
<span
style="margin: 0 0 20px 0; display: inline-block; vertical-align: middle; width: 100%;"
>
<a
target="_blank"
href="https://pikwizard.com/photo/financial-growth-graphs-over-junkyard-machines/d6b8a8b98ff88b3956efd1db76a1f7a6/"
style="text-decoration: none; font-size: 10px; margin: 0;"
>
<img src="https://pikwizard.com/pw/medium/d6b8a8b98ff88b3956efd1db76a1f7a6.jpg" style="margin: 0; width: 100%;" alt="" />
<p style="font-size: 12px; margin: 0;">PikWizard</p>
</a>
</span>
</span>
Free (free of charge)
Free for personal and commercial use.
Author: Authentic Images
Similar Free Stock Images

Premium


Premium


Premium


Premium


Premium


Premium


Premium


Premium


Premium


Premium


Premium


Premium


Premium


Premium


Premium


Premium


Premium


Premium


Premium


Premium


Premium


Premium


Premium


Premium


Premium