
- Home >
- Stock Photos >
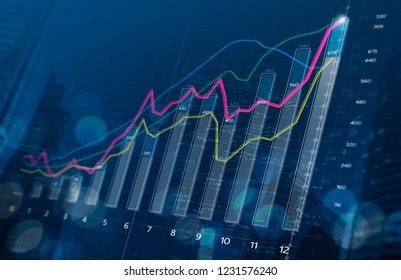
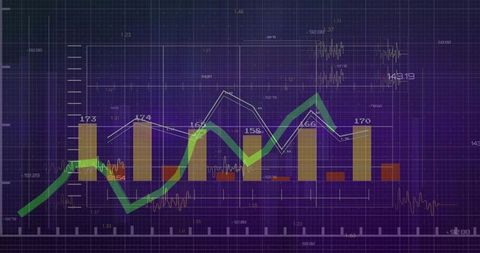
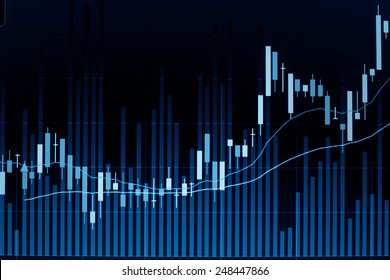
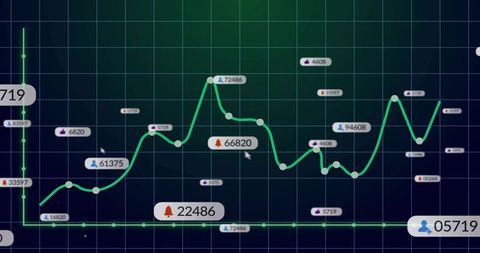
- Financial Growth Illustrated with Bar Charts and Upward Arrow
Financial Growth Illustrated with Bar Charts and Upward Arrow Image

Illustrating upward financial growth using bar charts and a green arrow, this conveys a positive trend in economic or market data. Suitable for presentations about market analysis, investment strategies, financial reports, and growth predictions. Ideal for economists, financial advisors, and data analysts focused on positive financial projections.
Powered by  - Get 15% off with code: PIKWIZARD15


0
downloads
downloads
Tags:
More
Credit Photo
If you would like to credit the Photo, here are some ways you can do so
Text Link
photo Link
<span class="text-link">
<span>
<a target="_blank" href=https://pikwizard.com/photo/financial-growth-illustrated-with-bar-charts-and-upward-arrow/5e033f8af3ccb331af9b4c41619f2ed6/>PikWizard</a>
</span>
</span>
<span class="image-link">
<span
style="margin: 0 0 20px 0; display: inline-block; vertical-align: middle; width: 100%;"
>
<a
target="_blank"
href="https://pikwizard.com/photo/financial-growth-illustrated-with-bar-charts-and-upward-arrow/5e033f8af3ccb331af9b4c41619f2ed6/"
style="text-decoration: none; font-size: 10px; margin: 0;"
>
<img src="https://pikwizard.com/pw/medium/5e033f8af3ccb331af9b4c41619f2ed6.jpg" style="margin: 0; width: 100%;" alt="" />
<p style="font-size: 12px; margin: 0;">PikWizard</p>
</a>
</span>
</span>
Free (free of charge)
Free for personal and commercial use.
Author: Creative Art
Similar Free Stock Images

Premium


Premium


Premium


Premium


Premium


Premium


Premium


Premium


Premium


Premium


Premium


Premium


Premium


Premium


Premium


Premium


Premium


Premium
Premium


Premium


Premium


Premium


Premium


Premium


Premium

