
- Home >
- Stock Photos >
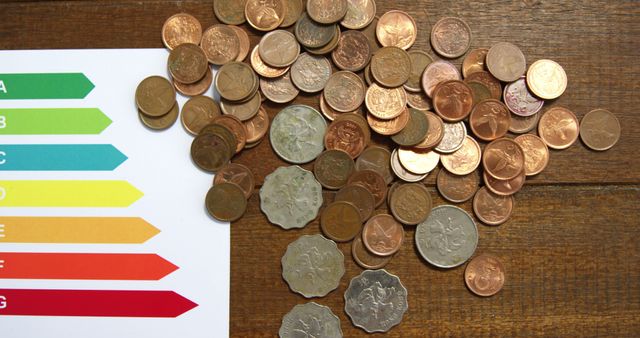
- Financial Growth Overlapping Coin Stack with Graph Visualizations
Financial Growth Overlapping Coin Stack with Graph Visualizations Image

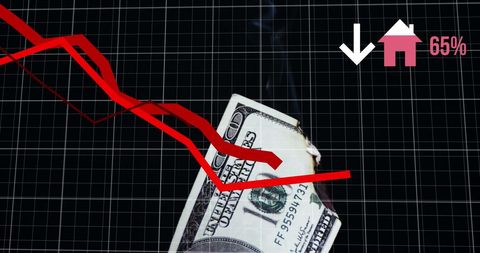
Illustration depicts financial data analysis merged with imagery of a jar spilling coins. Blue and green line graphs suggest growth or trend analysis. Useful for finance-focused content, investment visuals or financial analysis concepts. Engages audience looking for business and finance themes intertwined with digital technology representation.
Powered by  - Get 15% off with code: PIKWIZARD15


downloads
Tags:
More
Credit Photo
If you would like to credit the Photo, here are some ways you can do so
Text Link
photo Link
<span class="text-link">
<span>
<a target="_blank" href=https://pikwizard.com/photo/financial-growth-overlapping-coin-stack-with-graph-visualizations/a9810fd64cfd0b7197d6131c8c63fb01/>PikWizard</a>
</span>
</span>
<span class="image-link">
<span
style="margin: 0 0 20px 0; display: inline-block; vertical-align: middle; width: 100%;"
>
<a
target="_blank"
href="https://pikwizard.com/photo/financial-growth-overlapping-coin-stack-with-graph-visualizations/a9810fd64cfd0b7197d6131c8c63fb01/"
style="text-decoration: none; font-size: 10px; margin: 0;"
>
<img src="https://pikwizard.com/pw/medium/a9810fd64cfd0b7197d6131c8c63fb01.jpg" style="margin: 0; width: 100%;" alt="" />
<p style="font-size: 12px; margin: 0;">PikWizard</p>
</a>
</span>
</span>
Free (free of charge)
Free for personal and commercial use.
Author: Authentic Images
Similar Free Stock Images

Premium


Premium


Premium


Premium

Premium

Premium


Premium

Premium

Premium


Premium


Premium


Premium


Premium


Premium


Premium


Premium

Premium


Premium


Premium


Premium

Premium

Premium

Premium


Premium


Premium

Explore More Free Stock Images