- Home >
- Stock Photos >
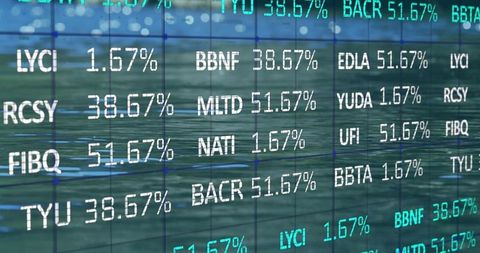
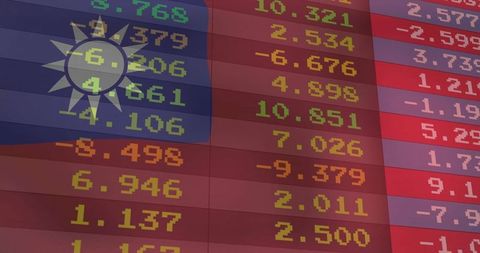
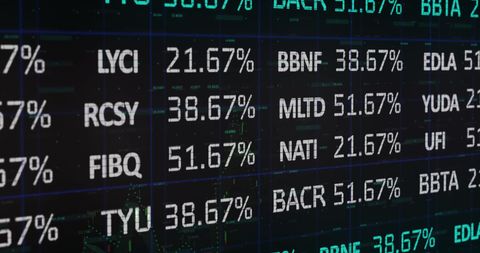
- Financial Indicator Surging on Global Market Data Display
Financial Indicator Surging on Global Market Data Display Image

This visual captures a financial market feeling with a large positive indicator superimposed over a dynamic data display, featuring ticker symbols and grid lines. It represents growth, optimism, and advancement in financial realms, making it suitable for news sites, stock market analysis platforms, and financial technology blogs to emphasize positive financial analysis or insights.
Powered by  - Get 15% off with code: PIKWIZARD15


2
downloads
downloads
Tags:
More
Credit Photo
If you would like to credit the Photo, here are some ways you can do so
Text Link
photo Link
<span class="text-link">
<span>
<a target="_blank" href=https://pikwizard.com/photo/financial-indicator-surging-on-global-market-data-display/996e50121b097d402a76d5482c810733/>PikWizard</a>
</span>
</span>
<span class="image-link">
<span
style="margin: 0 0 20px 0; display: inline-block; vertical-align: middle; width: 100%;"
>
<a
target="_blank"
href="https://pikwizard.com/photo/financial-indicator-surging-on-global-market-data-display/996e50121b097d402a76d5482c810733/"
style="text-decoration: none; font-size: 10px; margin: 0;"
>
<img src="https://pikwizard.com/pw/medium/996e50121b097d402a76d5482c810733.jpg" style="margin: 0; width: 100%;" alt="" />
<p style="font-size: 12px; margin: 0;">PikWizard</p>
</a>
</span>
</span>
Free (free of charge)
Free for personal and commercial use.
Author: Authentic Images
Similar Free Stock Images
Loading...

Premium


Premium

Premium


Premium


Premium


Premium


Premium


Premium

Premium

Premium


Premium

Premium


Premium


Premium


Premium


Premium

Premium


Premium


Premium

Premium


Premium


Premium


Premium


Premium


Premium