- Home >
- Stock Photos >
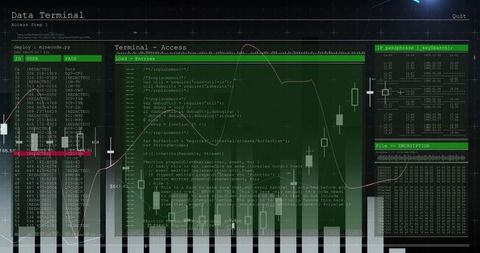
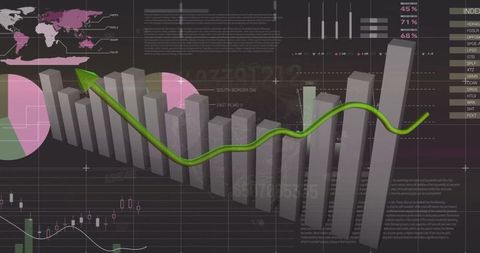
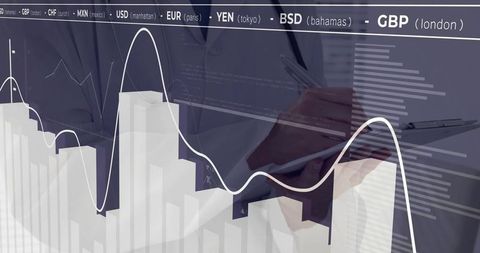
- Financial Market Analysis Graph with Currency Exchange
Financial Market Analysis Graph with Currency Exchange Image

Illustrating a digital financial market graph with currency exchanges and data processing elements, against a blue backdrop. Ideal for presentations on global business strategies, finance courses, and articles on market prediction tools. Useful for illustrating the concept of interconnected global economies and the fluctuation of currencies like USD, EUR, GBP.
Powered by  - Get 15% off with code: PIKWIZARD15


0
downloads
downloads
Tags:
More
Credit Photo
If you would like to credit the Photo, here are some ways you can do so
Text Link
photo Link
<span class="text-link">
<span>
<a target="_blank" href=https://pikwizard.com/photo/financial-market-analysis-graph-with-currency-exchange/bffb6fd81066d1fa8c8b88b45fc79c34/>PikWizard</a>
</span>
</span>
<span class="image-link">
<span
style="margin: 0 0 20px 0; display: inline-block; vertical-align: middle; width: 100%;"
>
<a
target="_blank"
href="https://pikwizard.com/photo/financial-market-analysis-graph-with-currency-exchange/bffb6fd81066d1fa8c8b88b45fc79c34/"
style="text-decoration: none; font-size: 10px; margin: 0;"
>
<img src="https://pikwizard.com/pw/medium/bffb6fd81066d1fa8c8b88b45fc79c34.jpg" style="margin: 0; width: 100%;" alt="" />
<p style="font-size: 12px; margin: 0;">PikWizard</p>
</a>
</span>
</span>
Free (free of charge)
Free for personal and commercial use.
Author: Creative Art
Similar Free Stock Images
Loading...

Premium


Premium


Premium


Premium


Premium


Premium


Premium


Premium


Premium


Premium


Premium


Premium


Premium


Premium


Premium


Premium


Premium


Premium

Premium


Premium


Premium


Premium


Premium


Premium

Premium