
- Home >
- Stock Photos >
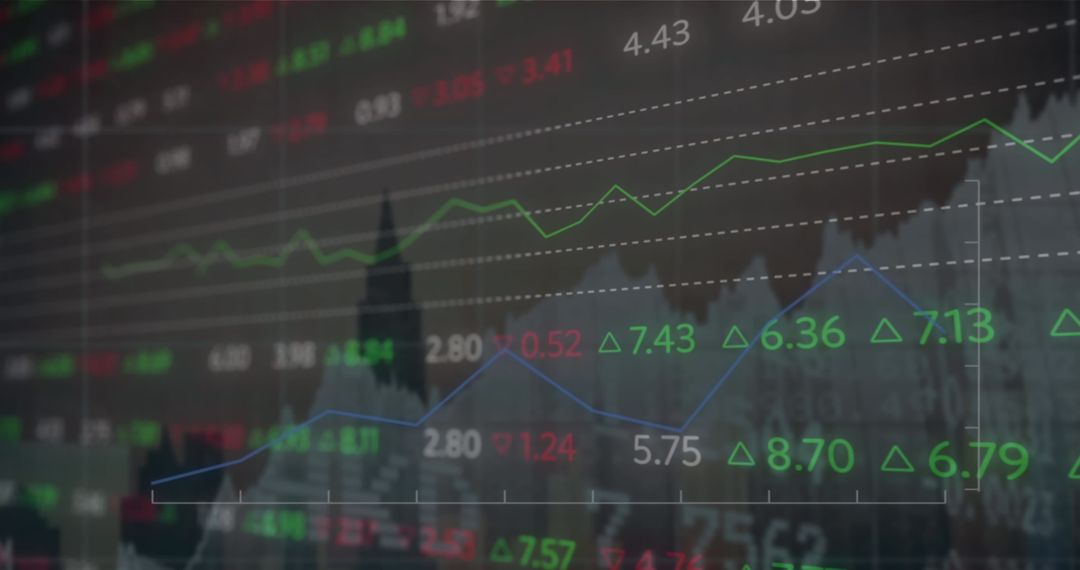
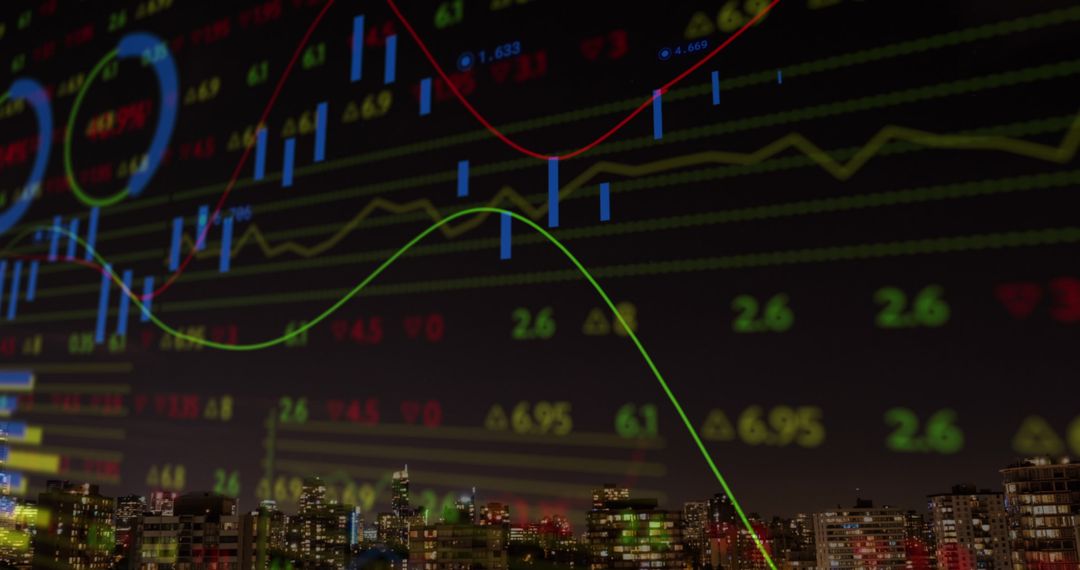
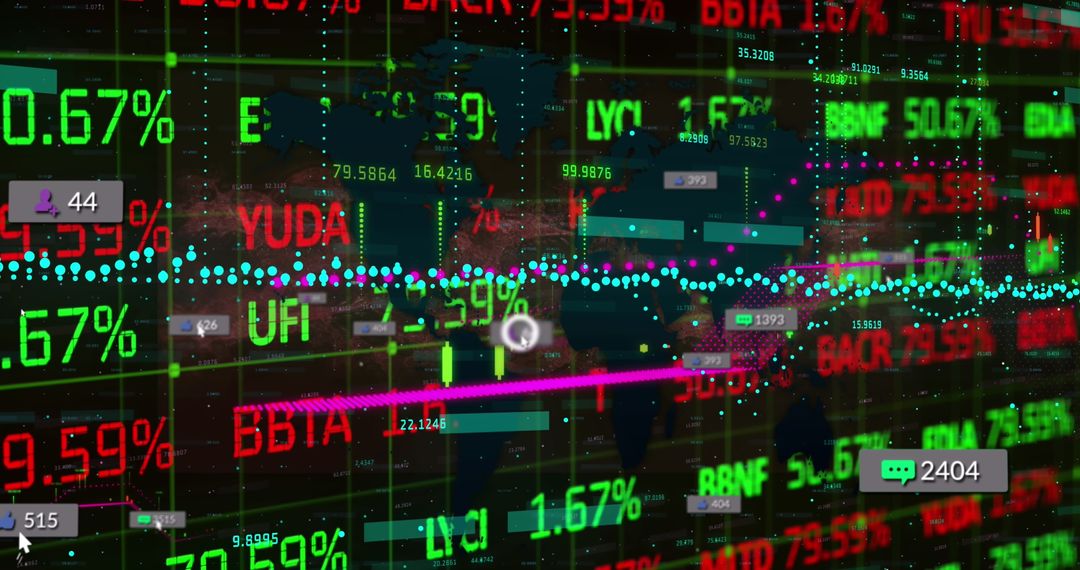
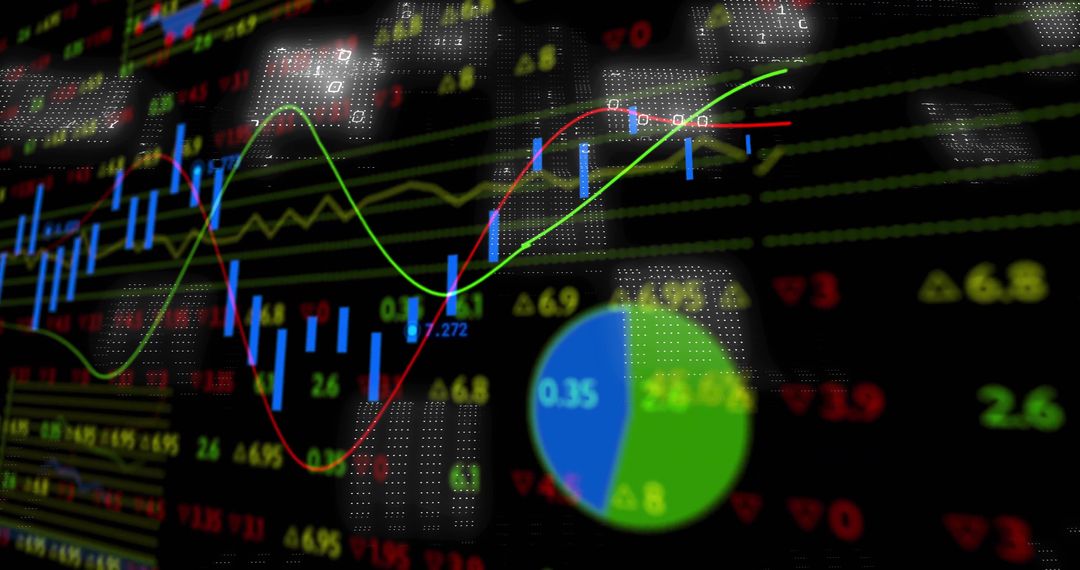
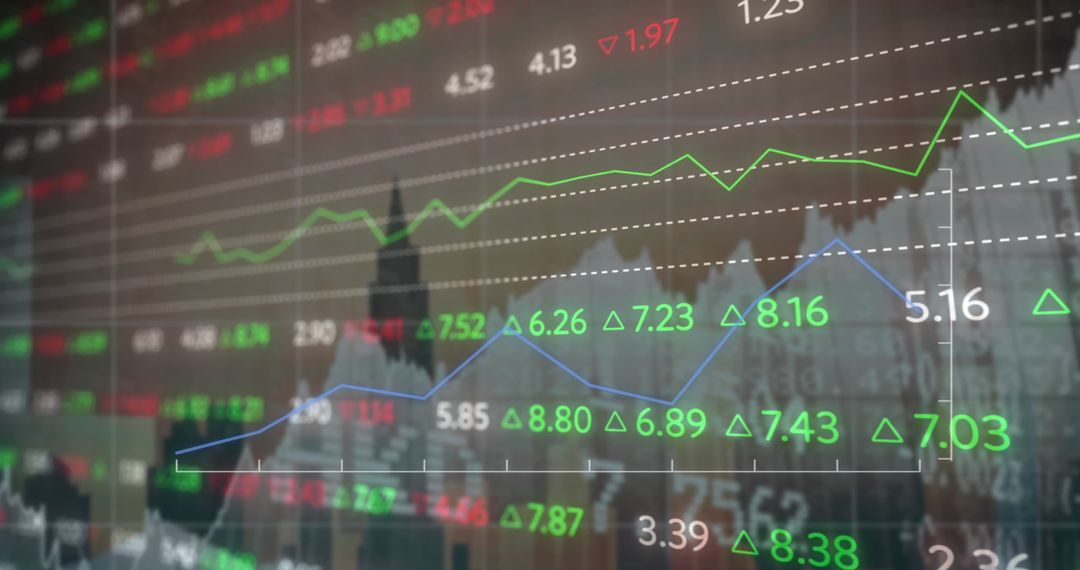
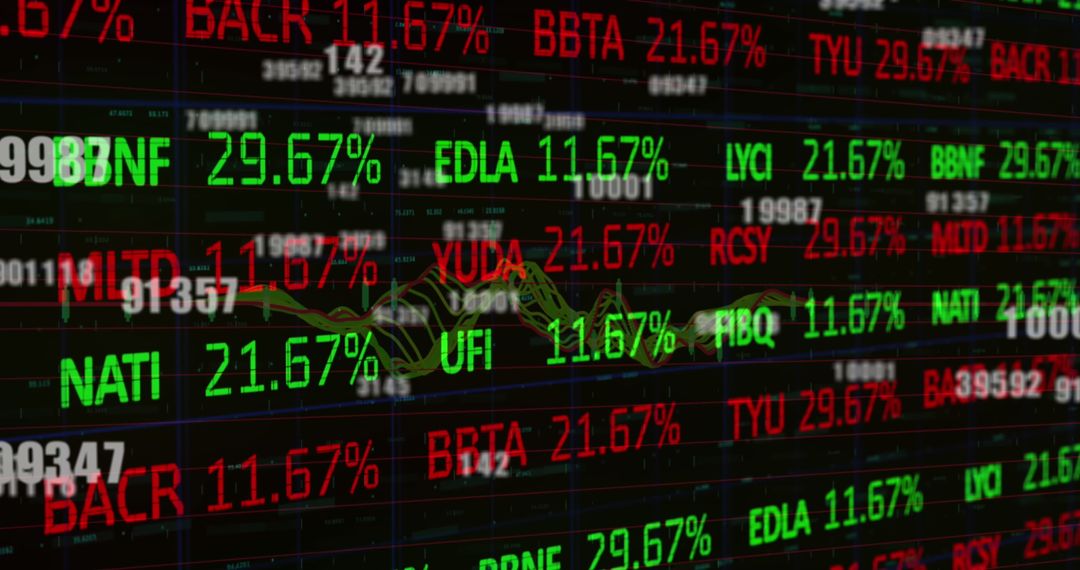
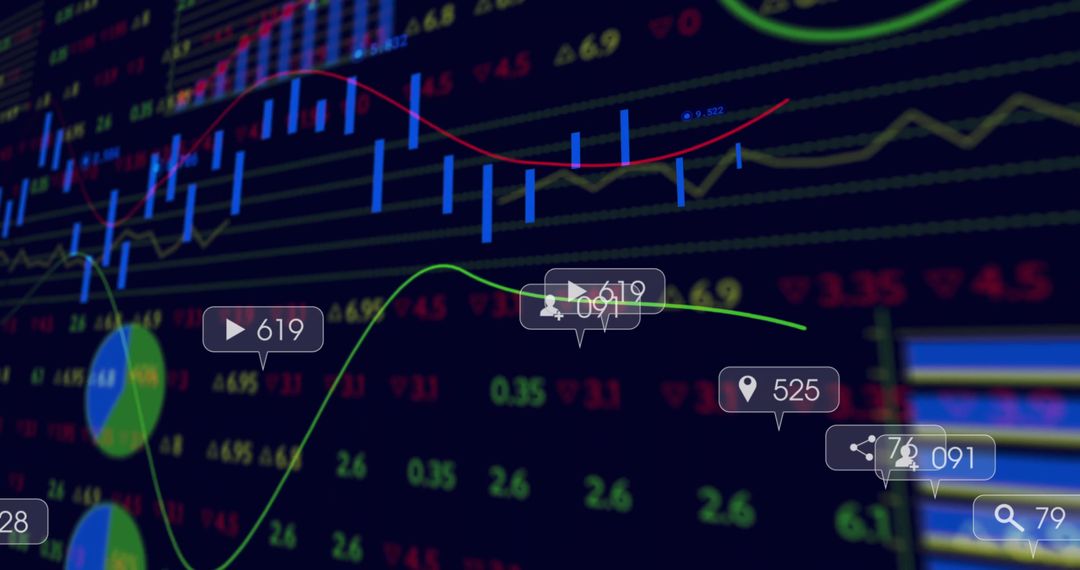
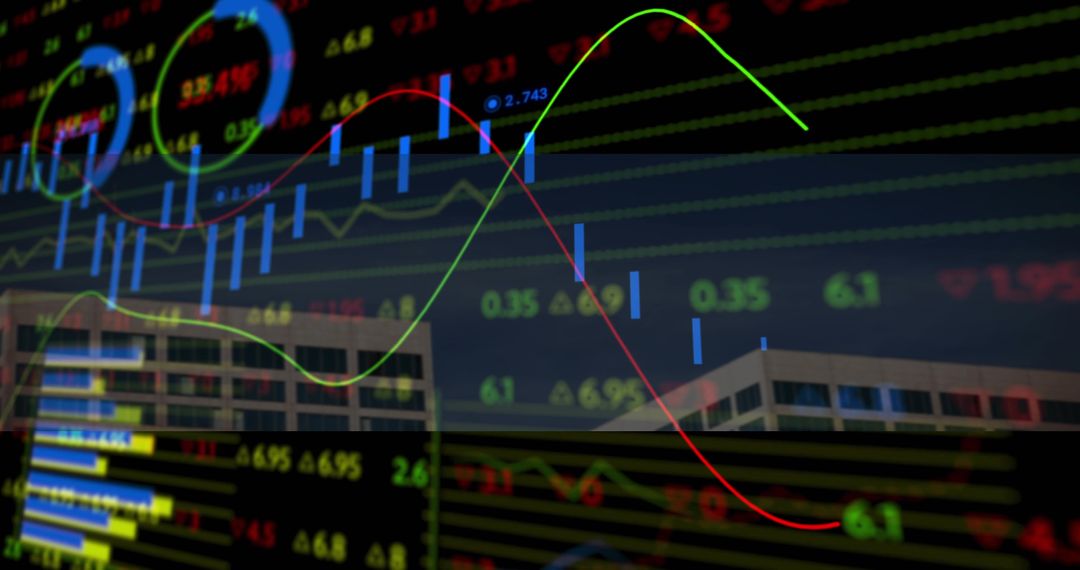
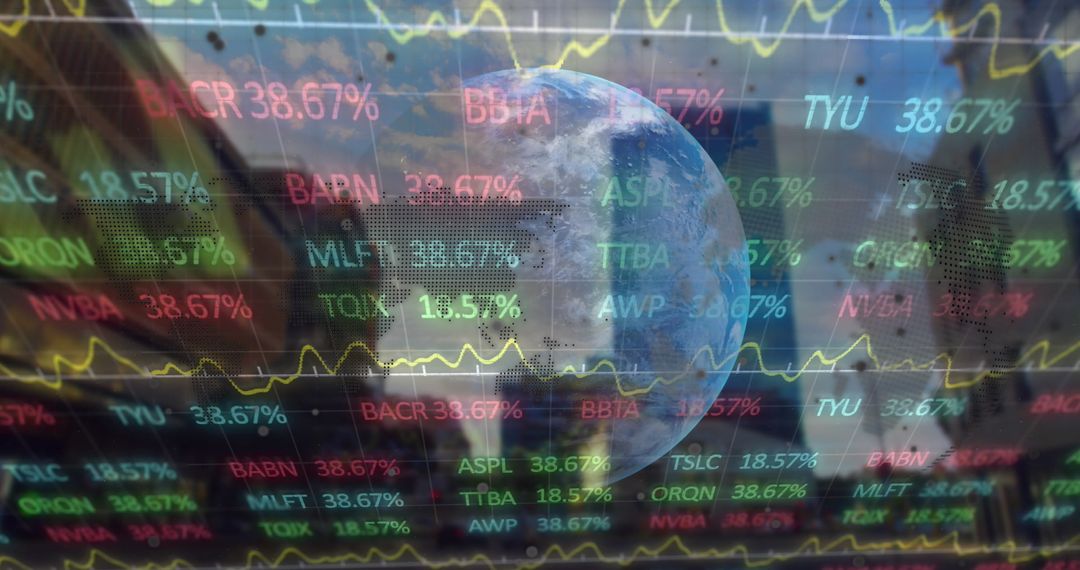
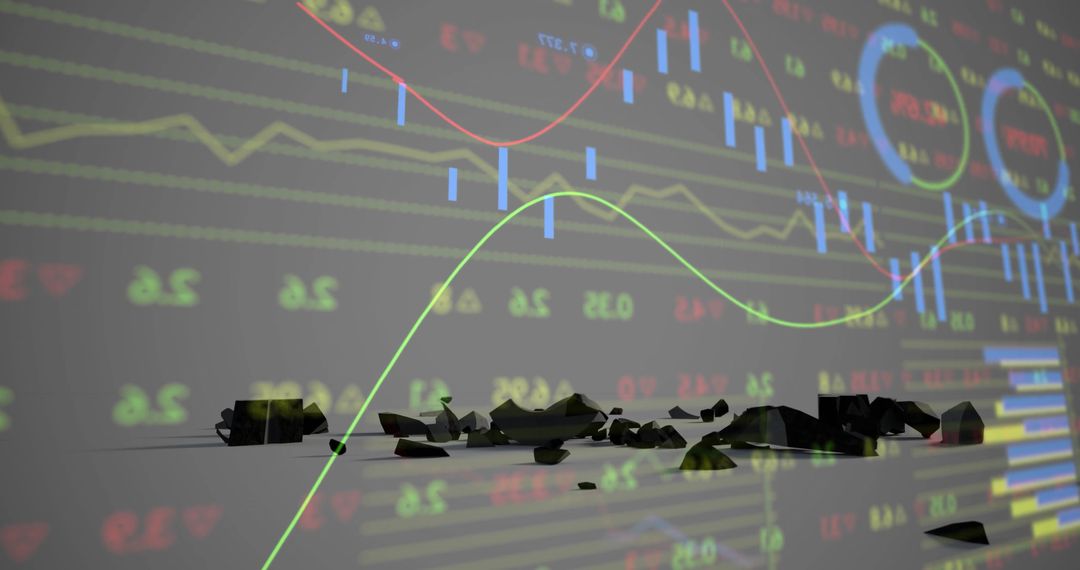
- Financial Market Analysis Showing Dynamic Charts and Graphs
Financial Market Analysis Showing Dynamic Charts and Graphs Image

Capturing the essence of financial markets, this displays dynamic representations such as candlestick charts, line graphs, and dynamic data visualizations. It's ideal for illustrating finance, investment strategies, and analytical work. Useful for bloggers and websites dedicated to business and economic trends.
Powered by  - Get 15% off with code: PIKWIZARD15


0
downloads
downloads
Tags:
More
Credit Photo
If you would like to credit the Photo, here are some ways you can do so
Text Link
photo Link
<span class="text-link">
<span>
<a target="_blank" href=https://pikwizard.com/photo/financial-market-analysis-showing-dynamic-charts-and-graphs/b16c2af5b91ee1273cda9fcc24935095/>PikWizard</a>
</span>
</span>
<span class="image-link">
<span
style="margin: 0 0 20px 0; display: inline-block; vertical-align: middle; width: 100%;"
>
<a
target="_blank"
href="https://pikwizard.com/photo/financial-market-analysis-showing-dynamic-charts-and-graphs/b16c2af5b91ee1273cda9fcc24935095/"
style="text-decoration: none; font-size: 10px; margin: 0;"
>
<img src="https://pikwizard.com/pw/medium/b16c2af5b91ee1273cda9fcc24935095.jpg" style="margin: 0; width: 100%;" alt="" />
<p style="font-size: 12px; margin: 0;">PikWizard</p>
</a>
</span>
</span>
Free (free of charge)
Free for personal and commercial use.
Author: Awesome Content
Similar Free Stock Images
Premium


Premium


Premium


Premium


Premium


Premium


Premium


Premium


Premium


Premium


Premium


Premium


Premium


Premium


Premium


Premium


Premium


Premium


Premium


Premium


Premium


Premium


Premium


Premium

