- Home >
- Stock Photos >
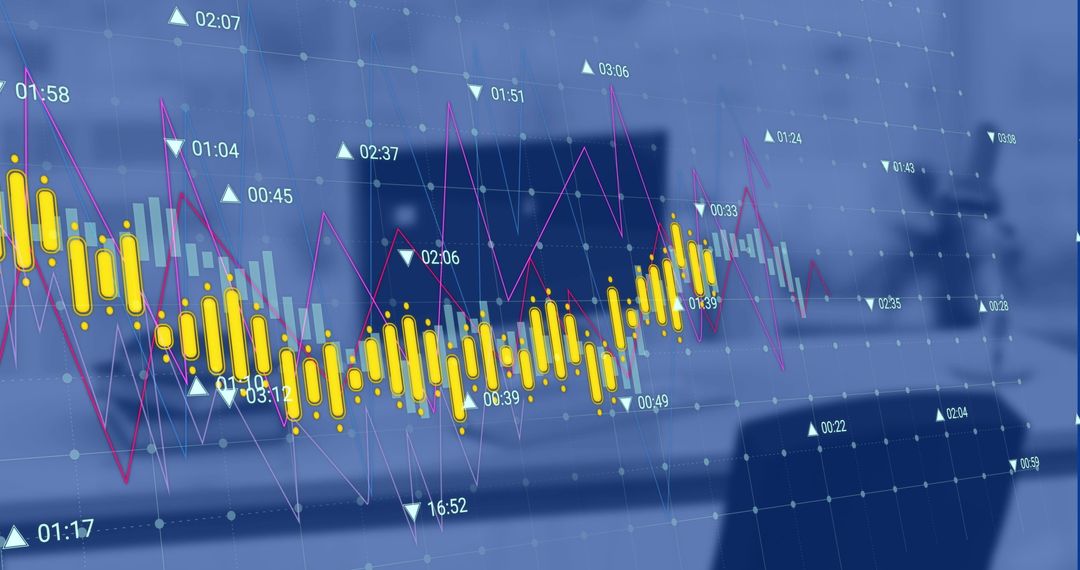
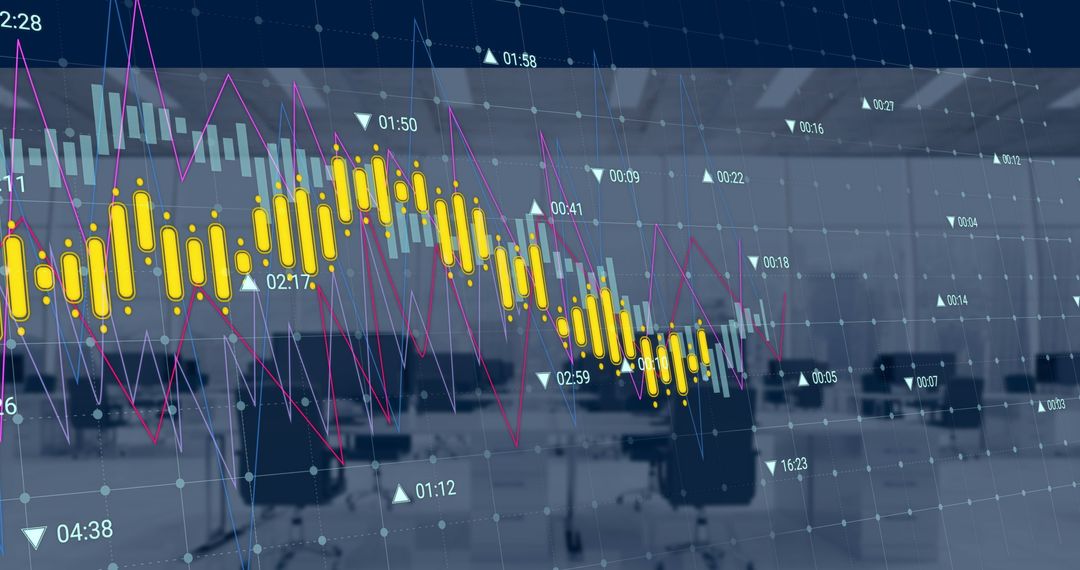
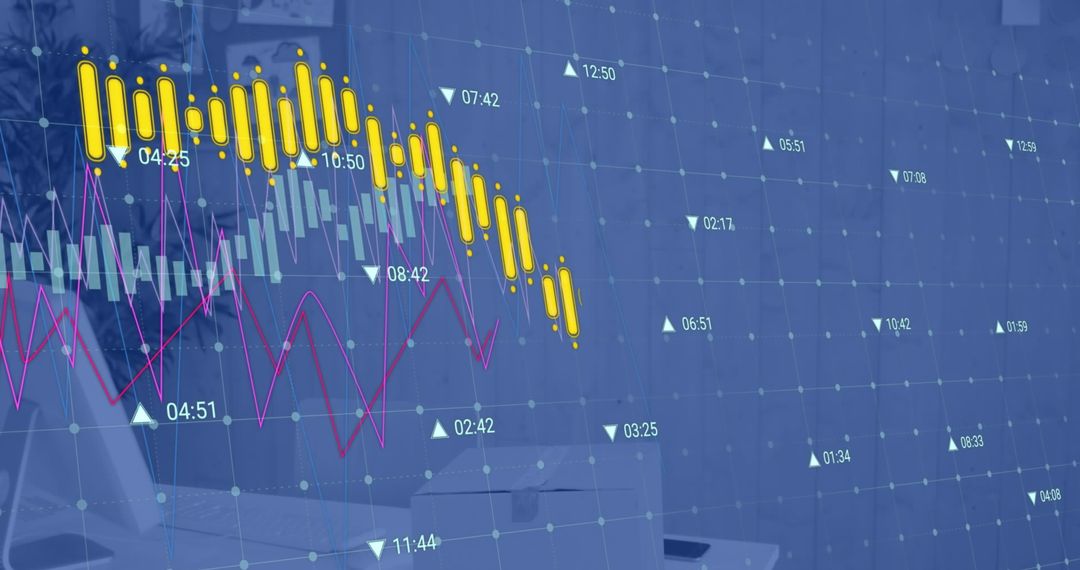
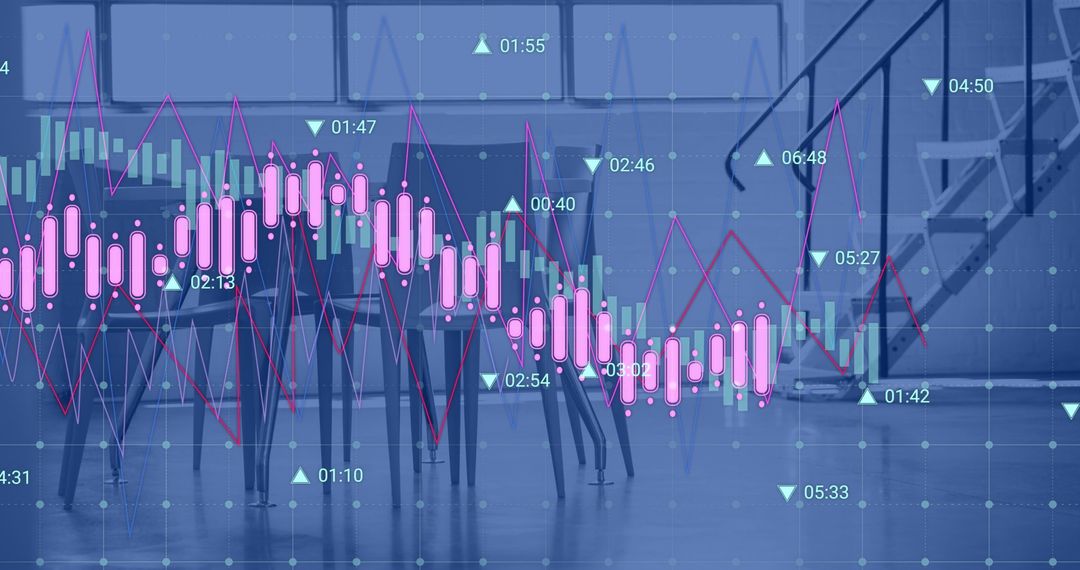
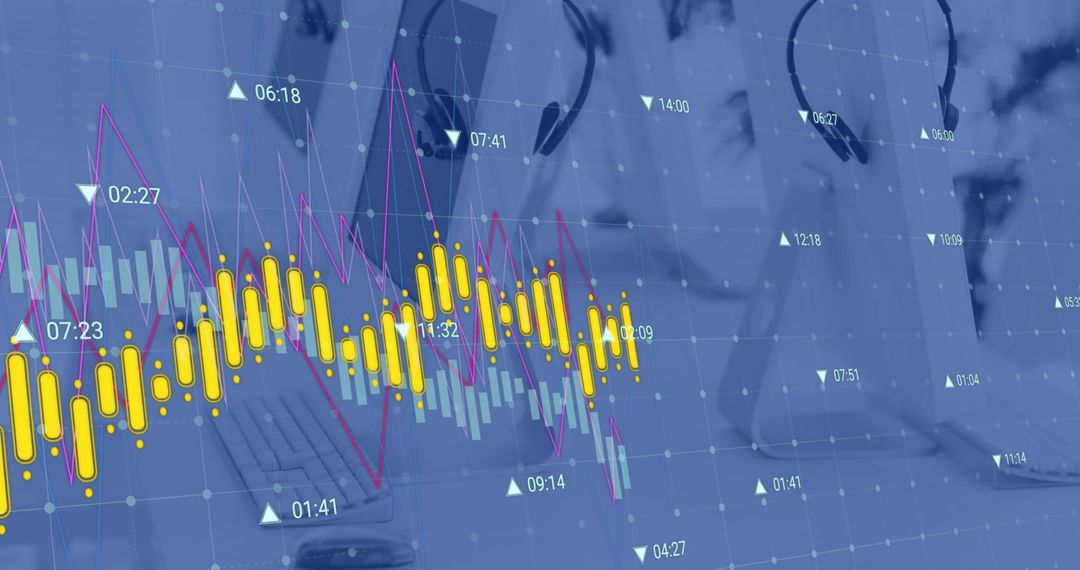
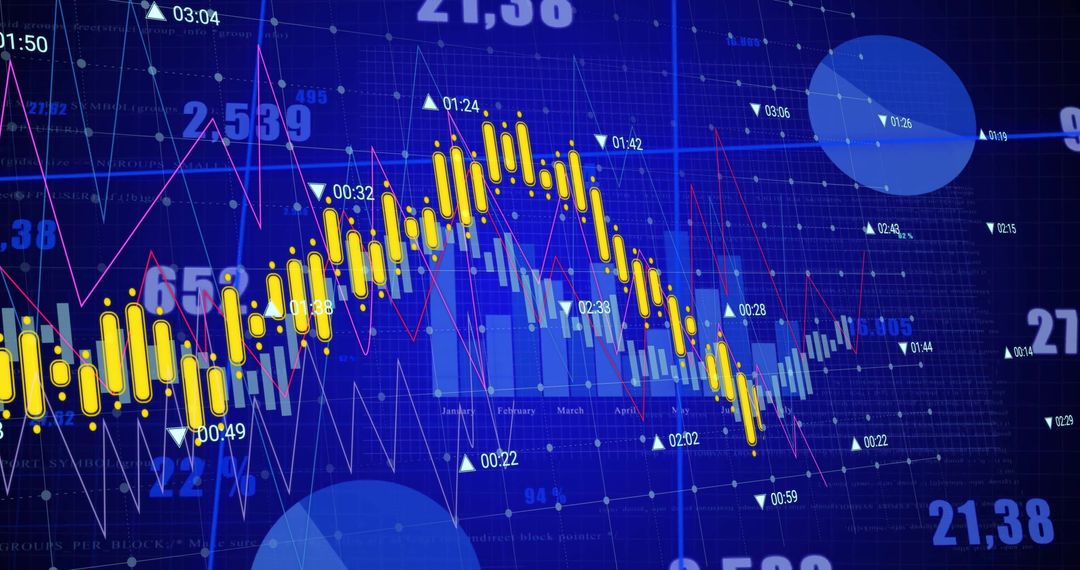
- Financial Market Analysis with Digital Graph Overlay
Financial Market Analysis with Digital Graph Overlay Image
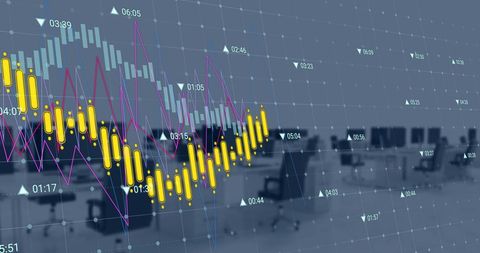
Graph and data emerging over empty office perfectly capture theme of modern business practices and advancement in finance technology. Useful for business presentations, articles on market trends, financial businesses, and digital innovation themes. Applications could also include content on workplace about future of work or envisioned for corporate slide decks emphasizing analysis and prediction in organizations.
Powered by 


0
downloads
downloads
Tags:
More
Credit Photo
If you would like to credit the Photo, here are some ways you can do so
Text Link
photo Link
<span class="text-link">
<span>
<a target="_blank" href=https://pikwizard.com/photo/financial-market-analysis-with-digital-graph-overlay/5ed8a4ea2c1fbaa9843b1af7d0598df7/>PikWizard</a>
</span>
</span>
<span class="image-link">
<span
style="margin: 0 0 20px 0; display: inline-block; vertical-align: middle; width: 100%;"
>
<a
target="_blank"
href="https://pikwizard.com/photo/financial-market-analysis-with-digital-graph-overlay/5ed8a4ea2c1fbaa9843b1af7d0598df7/"
style="text-decoration: none; font-size: 10px; margin: 0;"
>
<img src="https://pikwizard.com/pw/medium/5ed8a4ea2c1fbaa9843b1af7d0598df7.jpg" style="margin: 0; width: 100%;" alt="" />
<p style="font-size: 12px; margin: 0;">PikWizard</p>
</a>
</span>
</span>
Free (free of charge)
Free for personal and commercial use.
Author: Authentic Images
Similar Free Stock Images

Premium


Premium


Premium

Premium


Premium


Premium


Premium


Premium


Premium


Premium


Premium


Premium


Premium


Premium


Premium


Premium


Premium


Premium


Premium


Premium


Premium


Premium


Premium


Premium