- Home >
- Stock Photos >
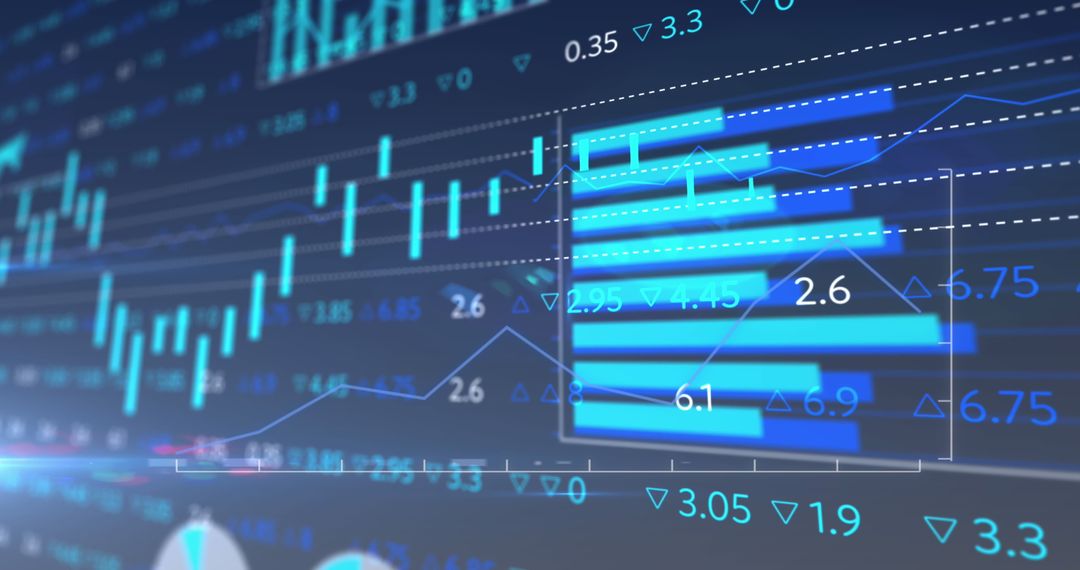
- Financial Market Analysis with Graphs and Data Blue Technology
Financial Market Analysis with Graphs and Data Blue Technology Image

Dynamic visualization of stock market analysis on blue digital background offers insights useful for projects about business trends, market forecasts, or technology-driven financial platforms. Ideal for presentations, reports, or educational materials focused on economics or statistics.
Powered by 


2
downloads
downloads
Tags:
More
Credit Photo
If you would like to credit the Photo, here are some ways you can do so
Text Link
photo Link
<span class="text-link">
<span>
<a target="_blank" href=https://pikwizard.com/photo/financial-market-analysis-with-graphs-and-data-blue-technology/dffc434aa13066bfaea6fa81c66d77f9/>PikWizard</a>
</span>
</span>
<span class="image-link">
<span
style="margin: 0 0 20px 0; display: inline-block; vertical-align: middle; width: 100%;"
>
<a
target="_blank"
href="https://pikwizard.com/photo/financial-market-analysis-with-graphs-and-data-blue-technology/dffc434aa13066bfaea6fa81c66d77f9/"
style="text-decoration: none; font-size: 10px; margin: 0;"
>
<img src="https://pikwizard.com/pw/medium/dffc434aa13066bfaea6fa81c66d77f9.jpg" style="margin: 0; width: 100%;" alt="" />
<p style="font-size: 12px; margin: 0;">PikWizard</p>
</a>
</span>
</span>
Free (free of charge)
Free for personal and commercial use.
Author: People Creations
Similar Free Stock Images

Premium


Premium


Premium


Premium


Premium


Premium


Premium


Premium


Premium


Premium


Premium


Premium


Premium


Premium


Premium


Premium


Premium


Premium


Premium


Premium


Premium


Premium


Premium


Premium