- Home >
- Stock Photos >
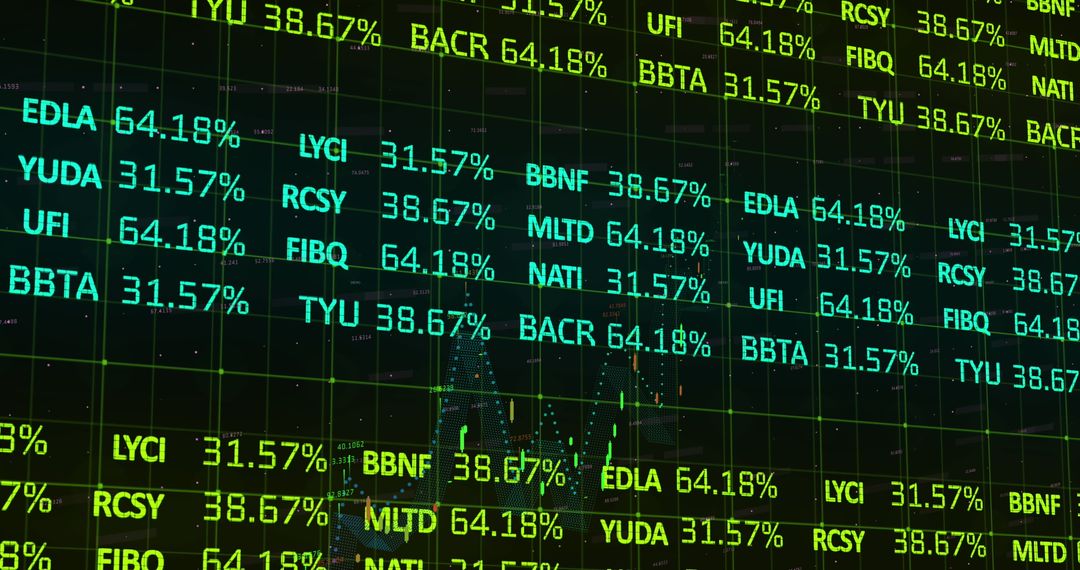
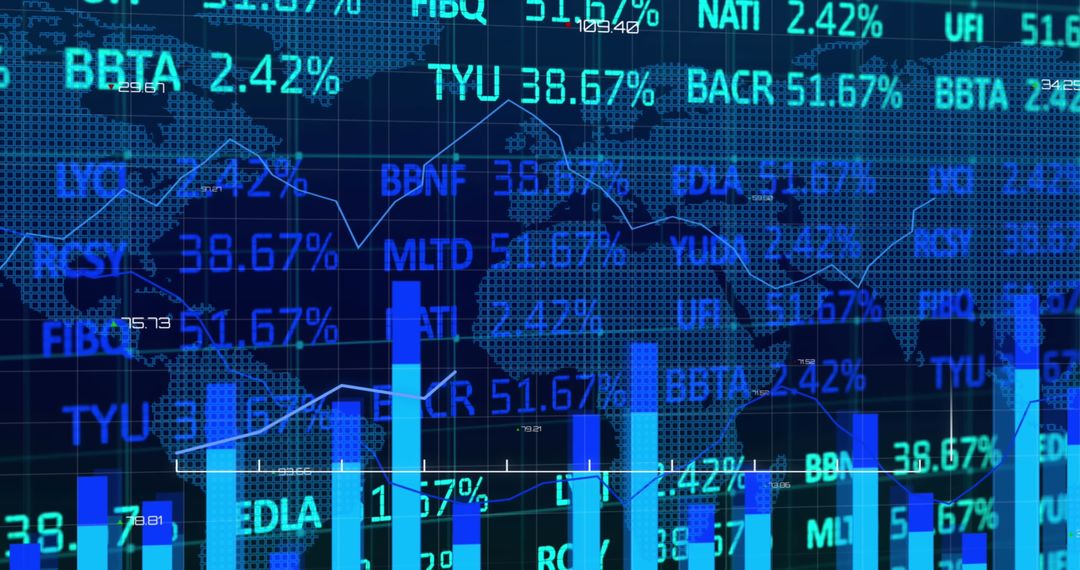
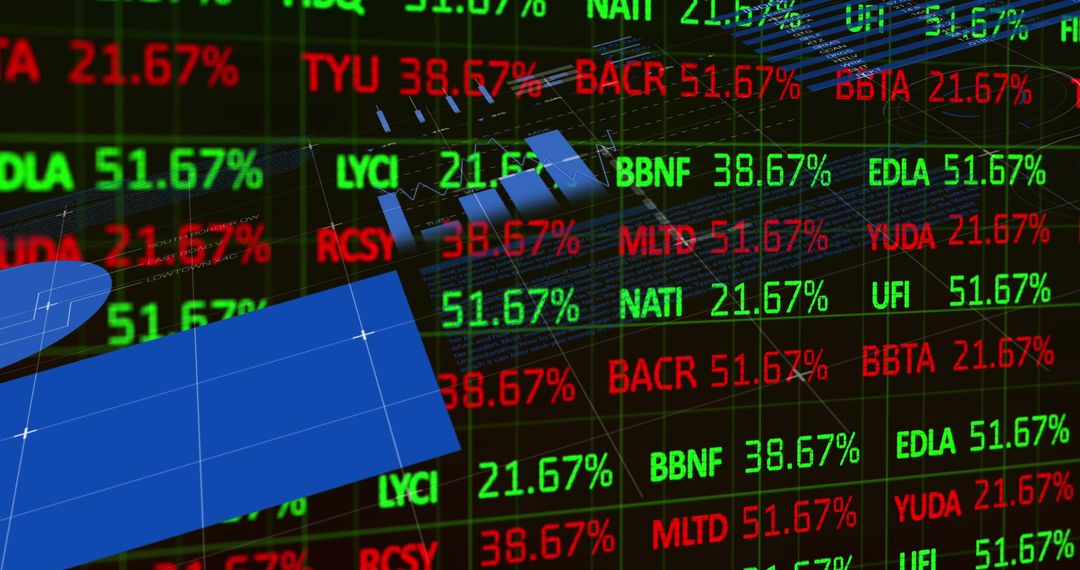
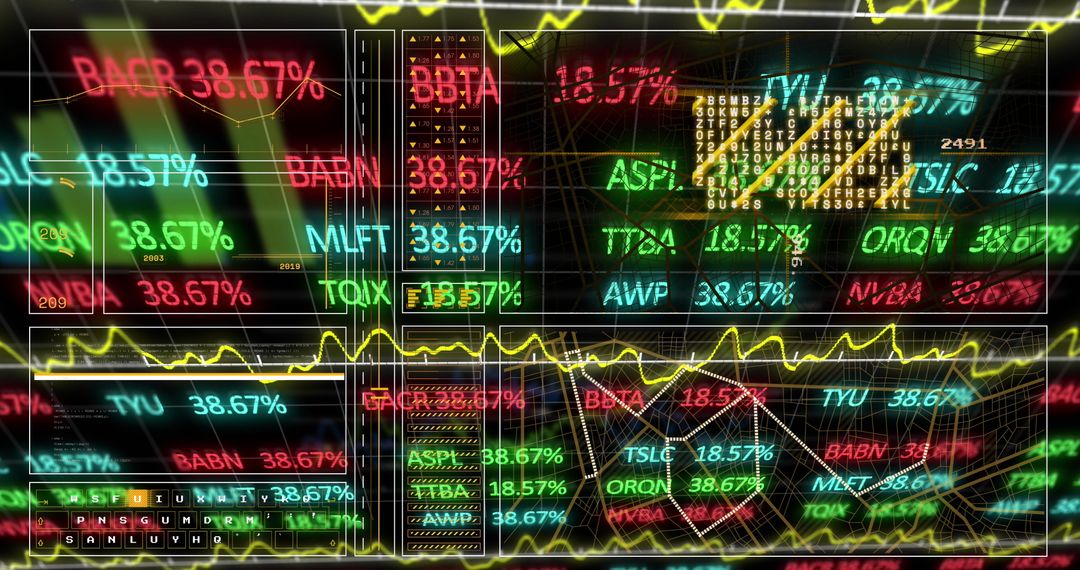
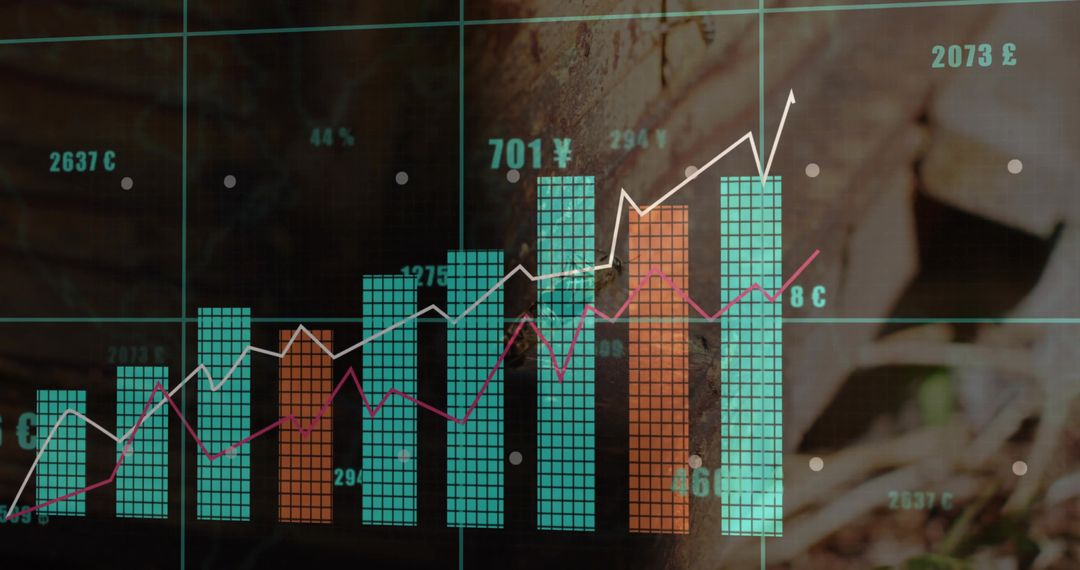
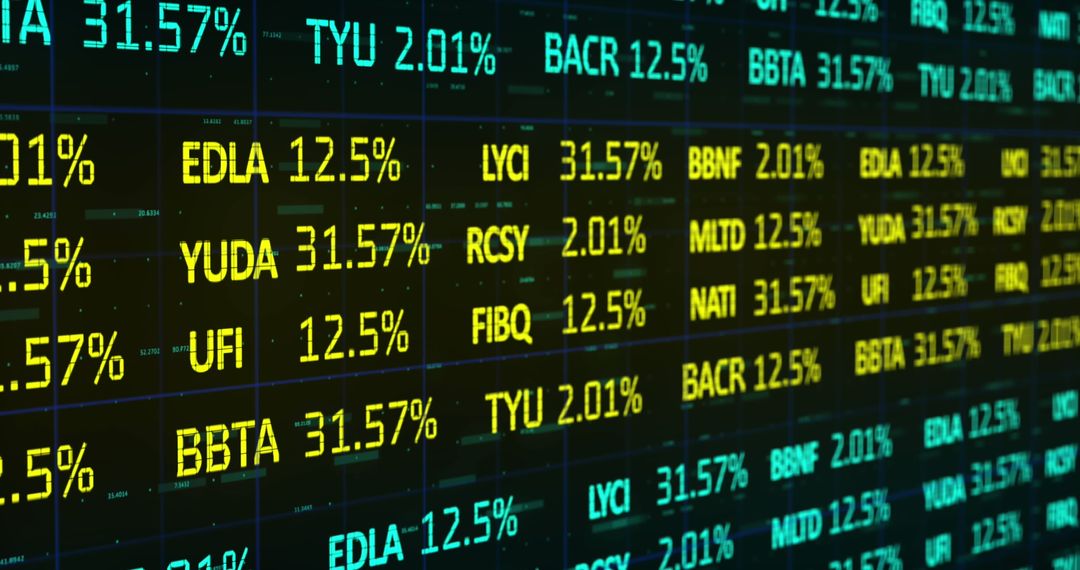
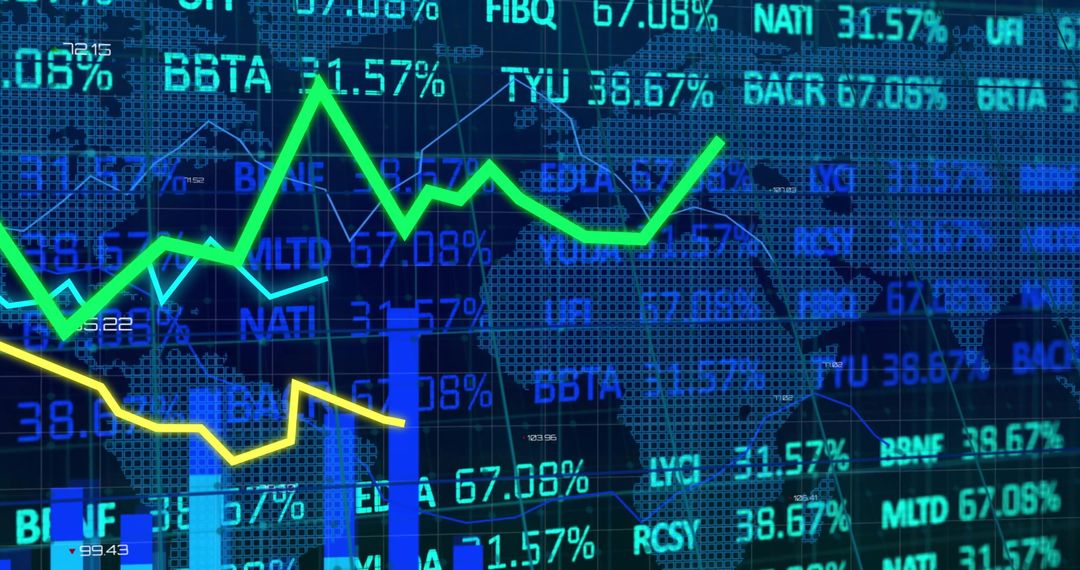
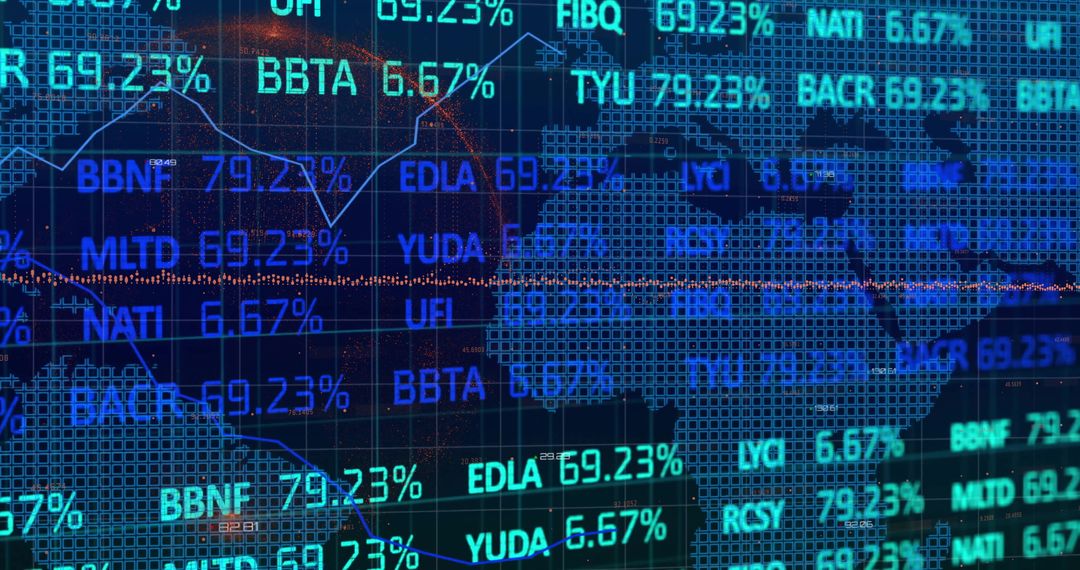
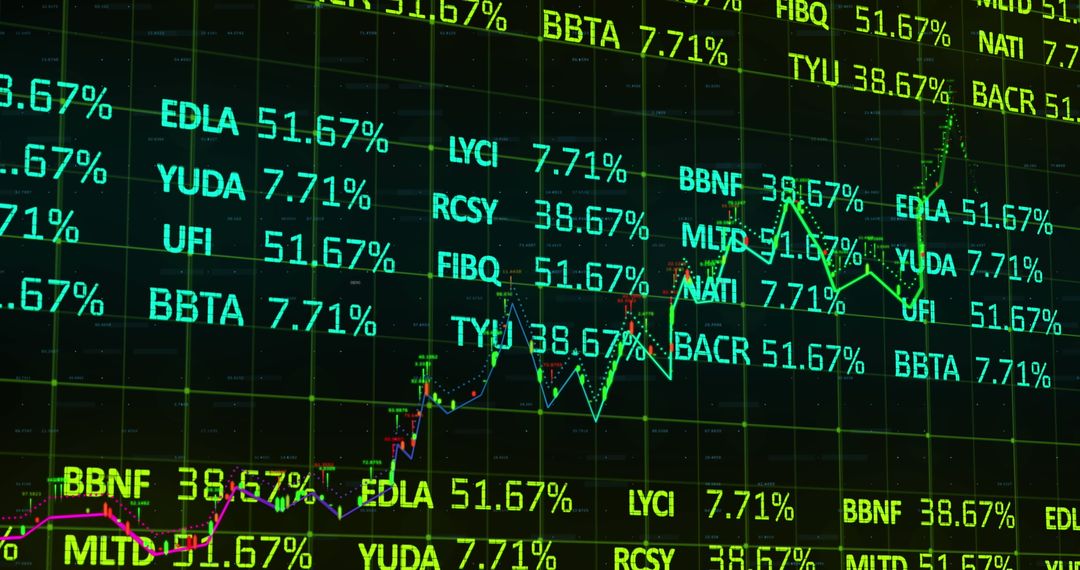
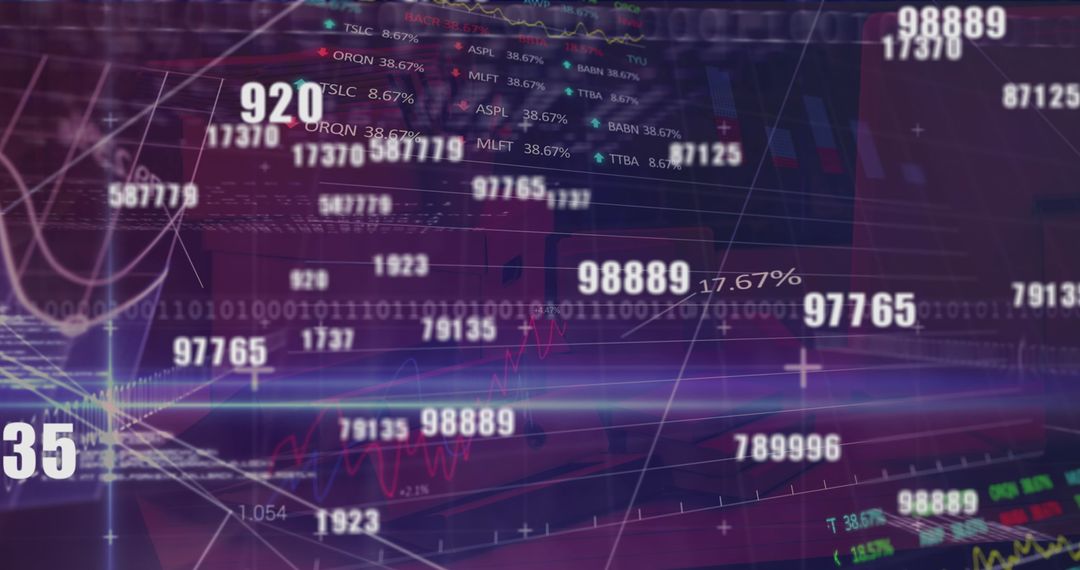
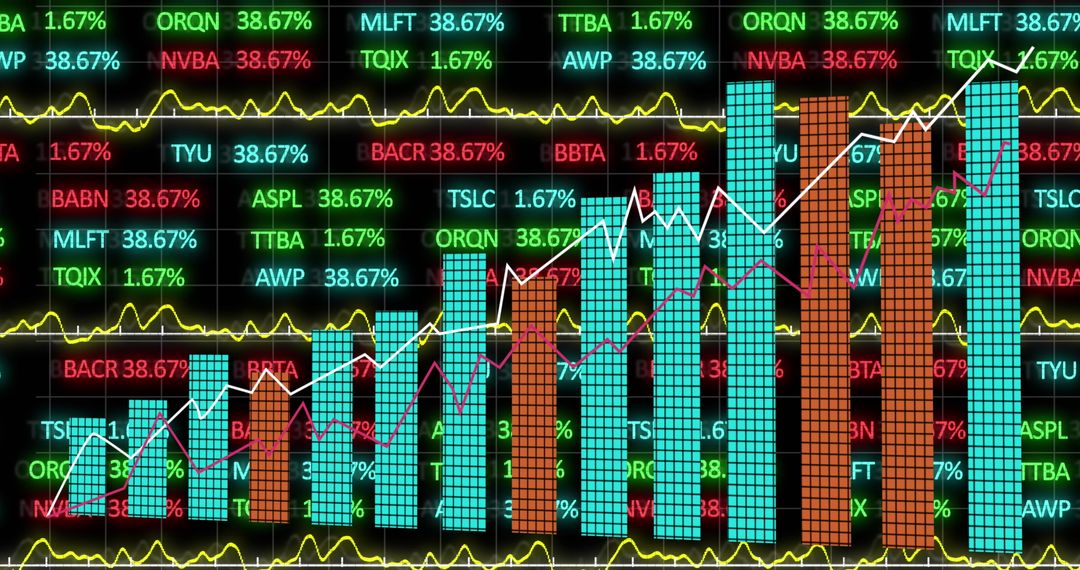
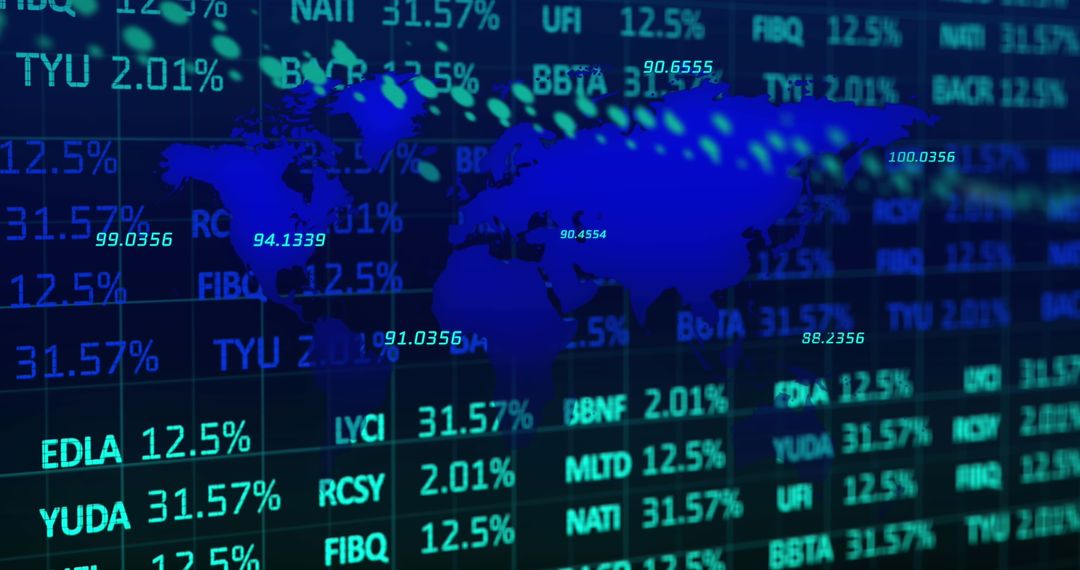
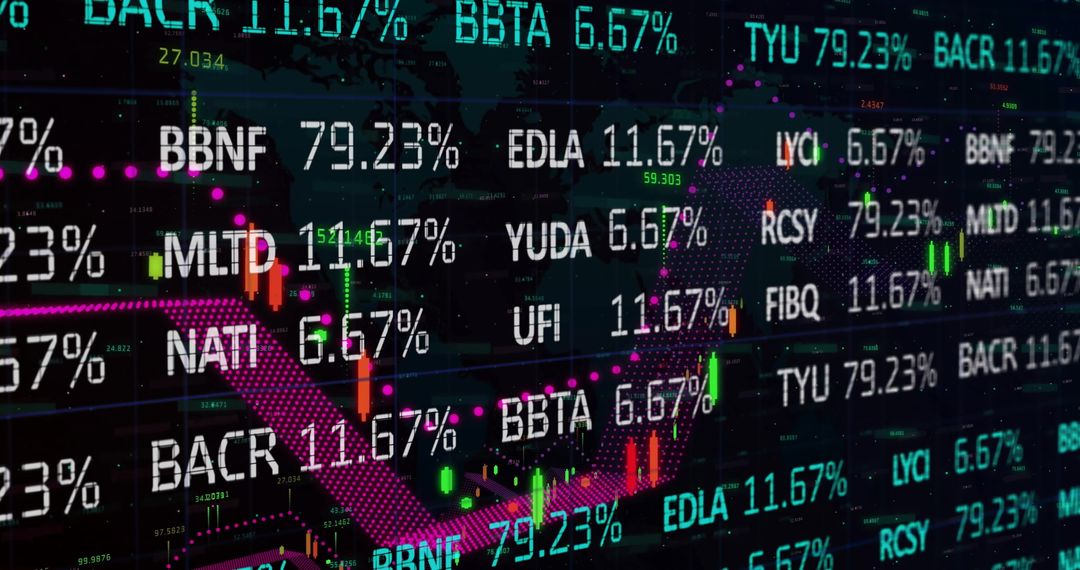
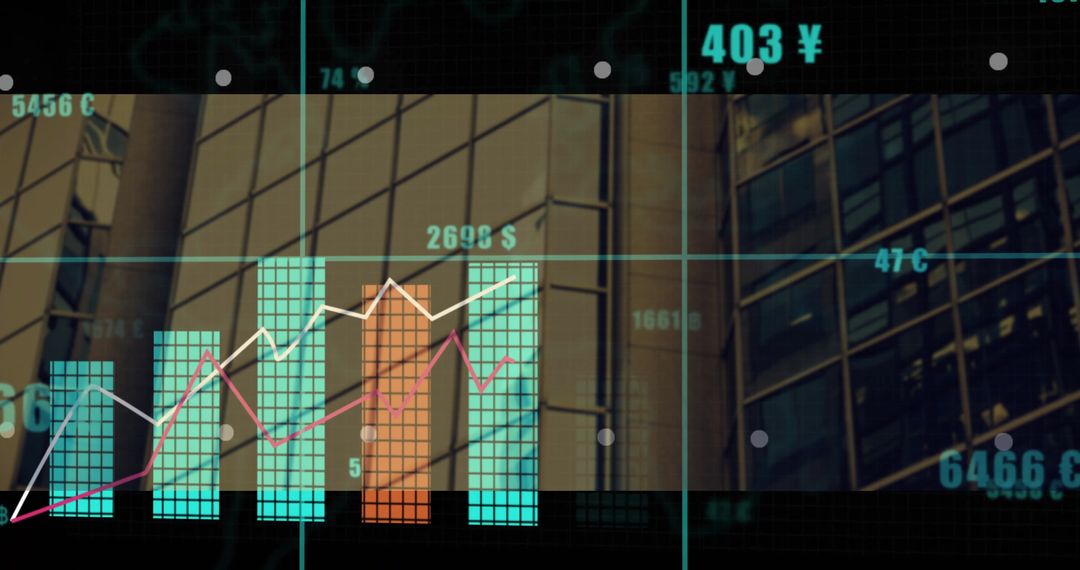
- Financial Market Analytics on Digital Screen With Trend Lines
Financial Market Analytics on Digital Screen With Trend Lines Image
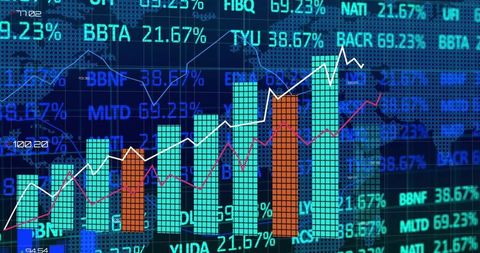
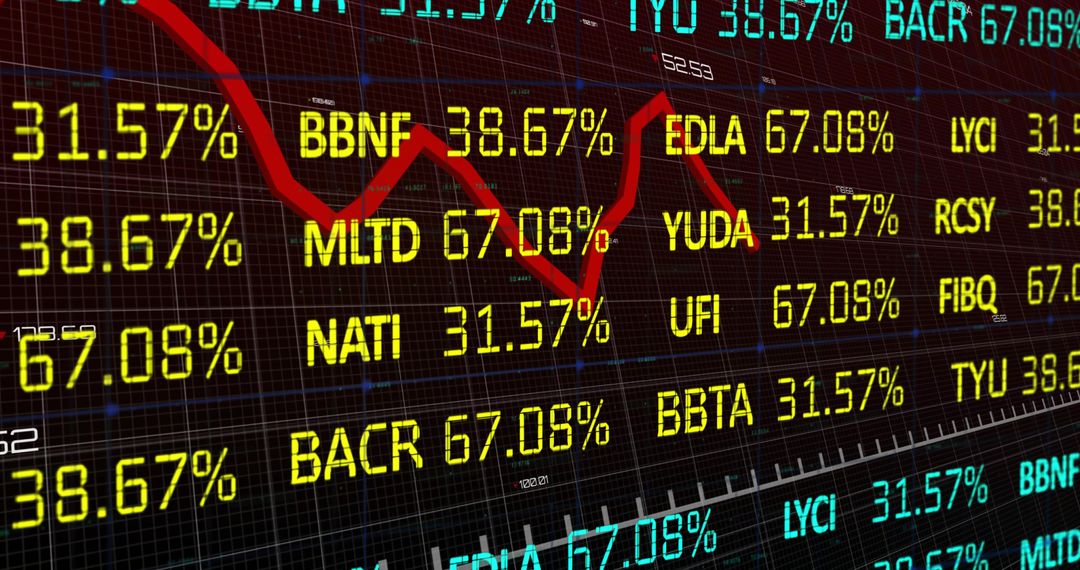
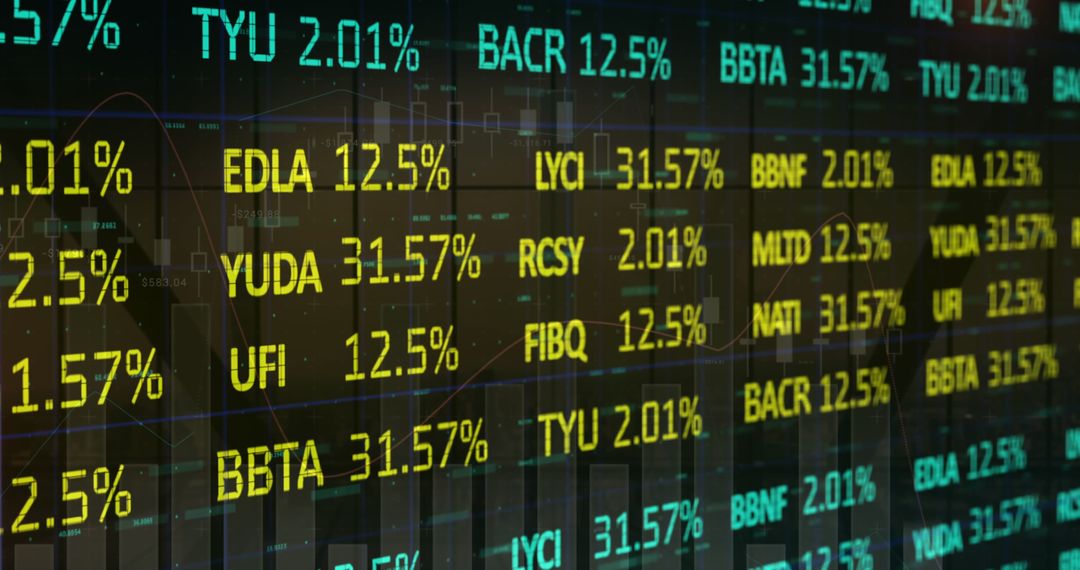
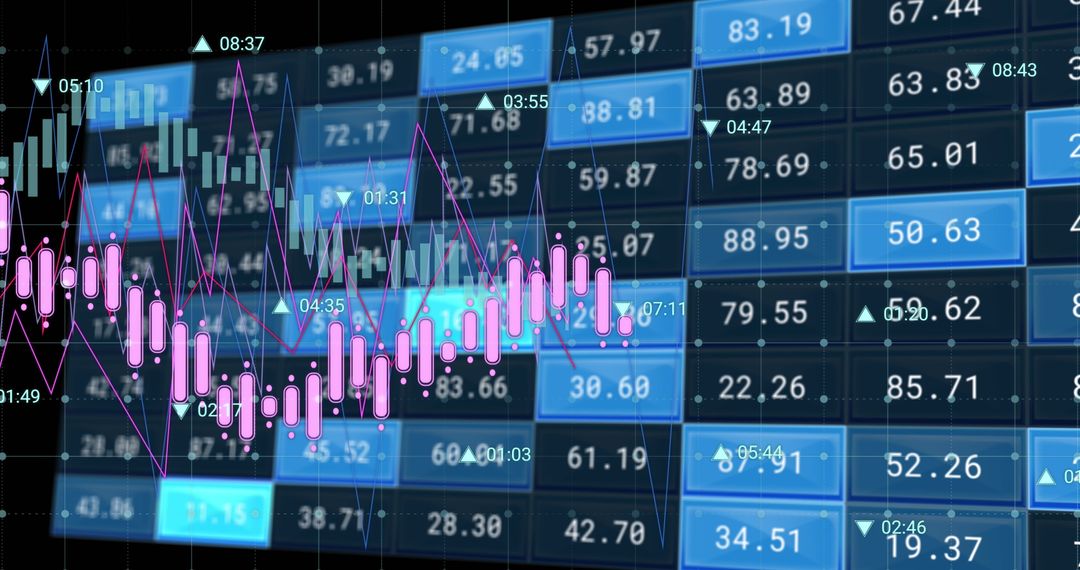
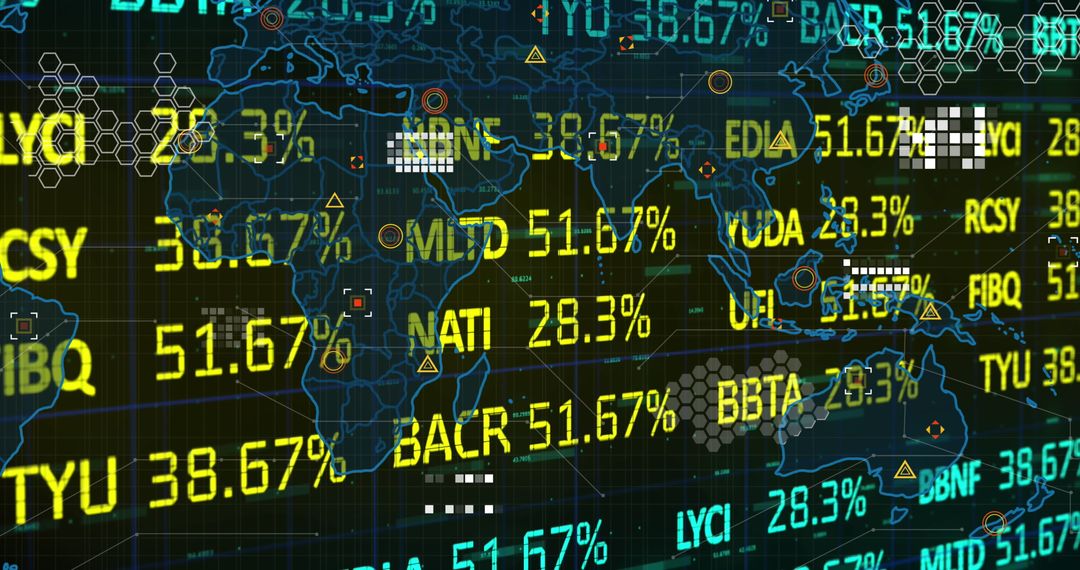
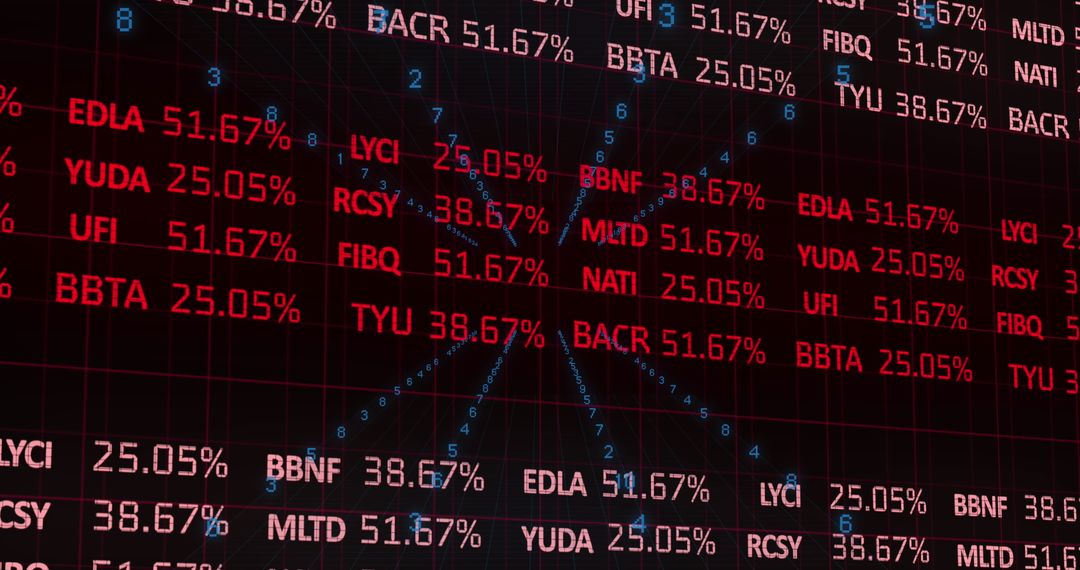
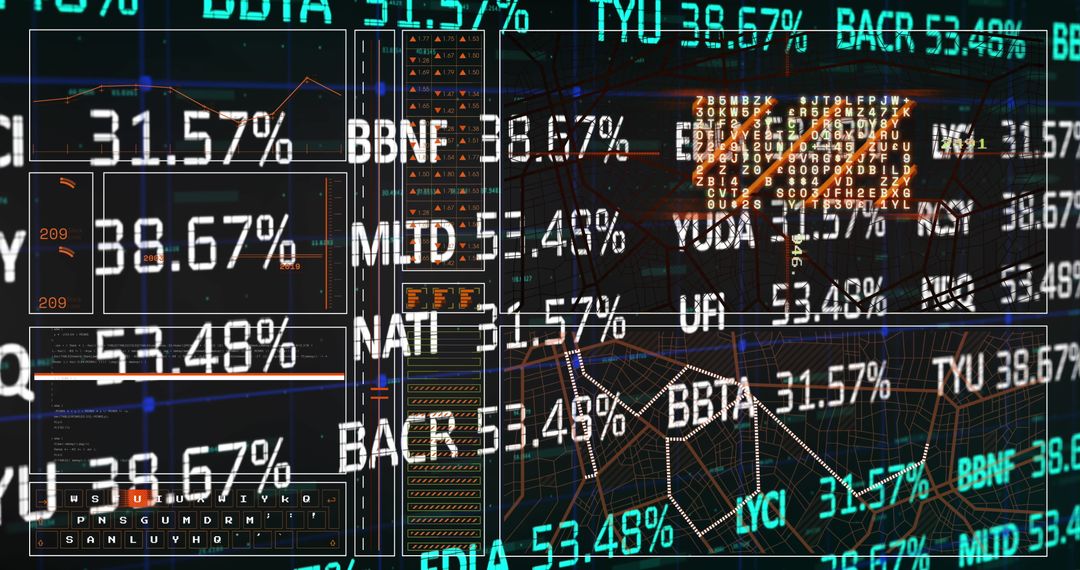
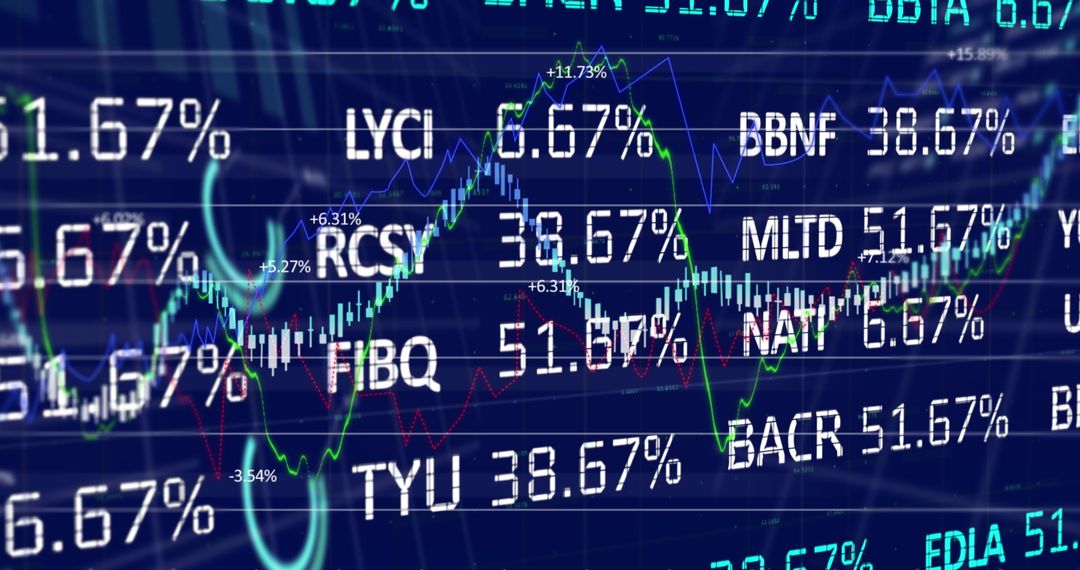
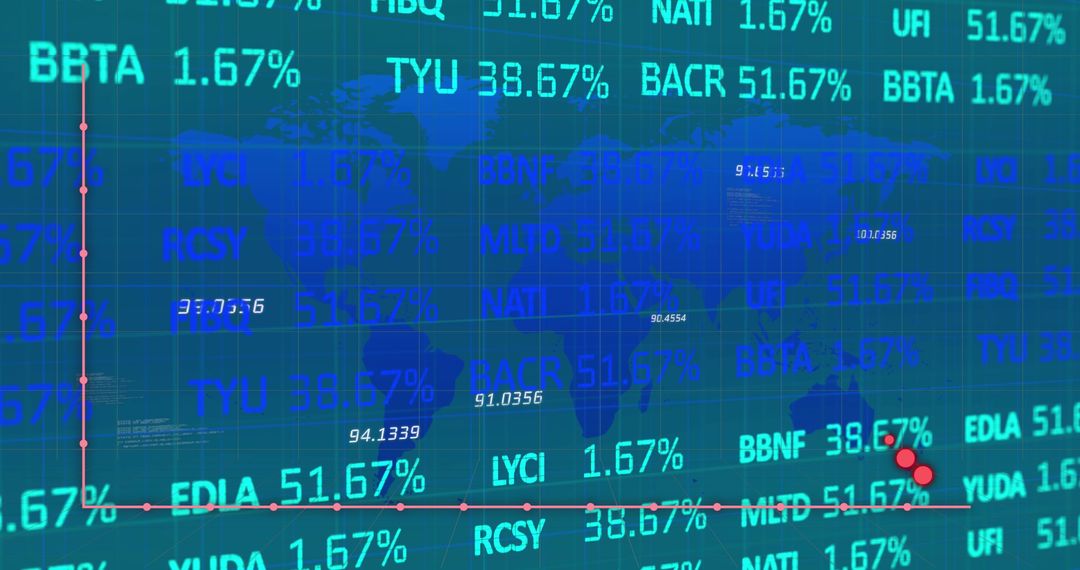
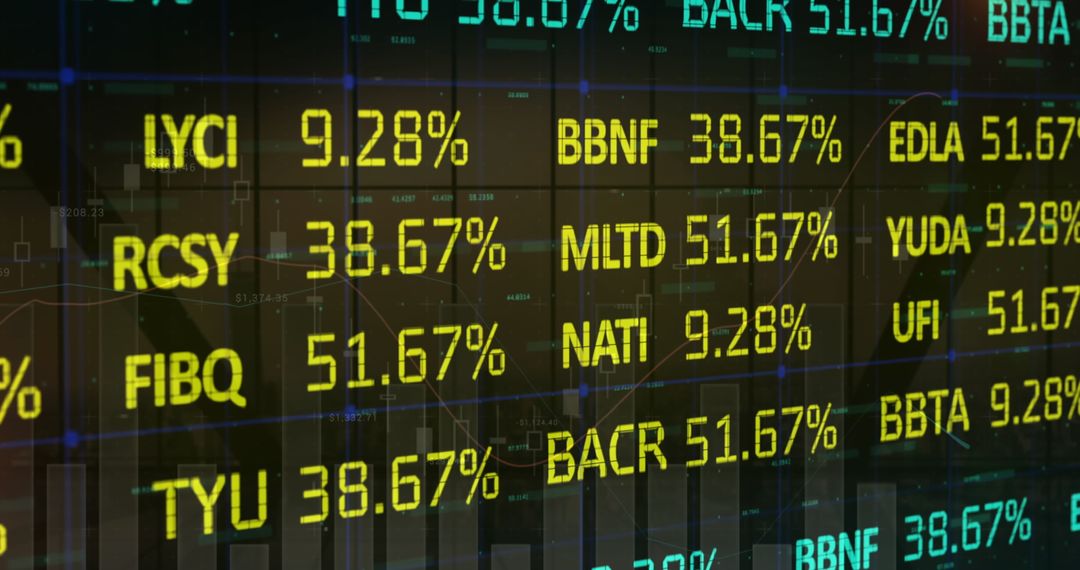
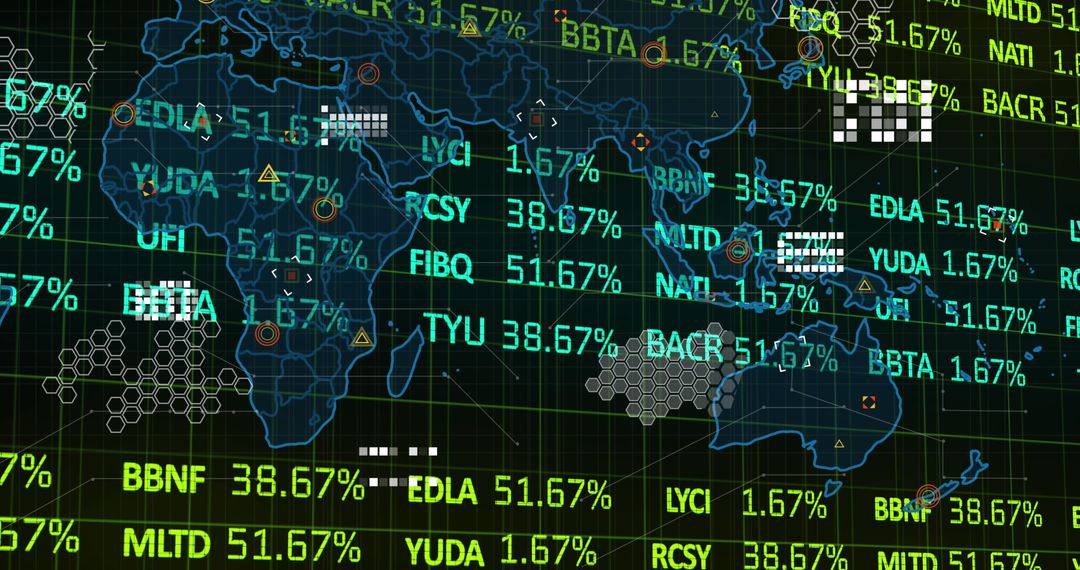
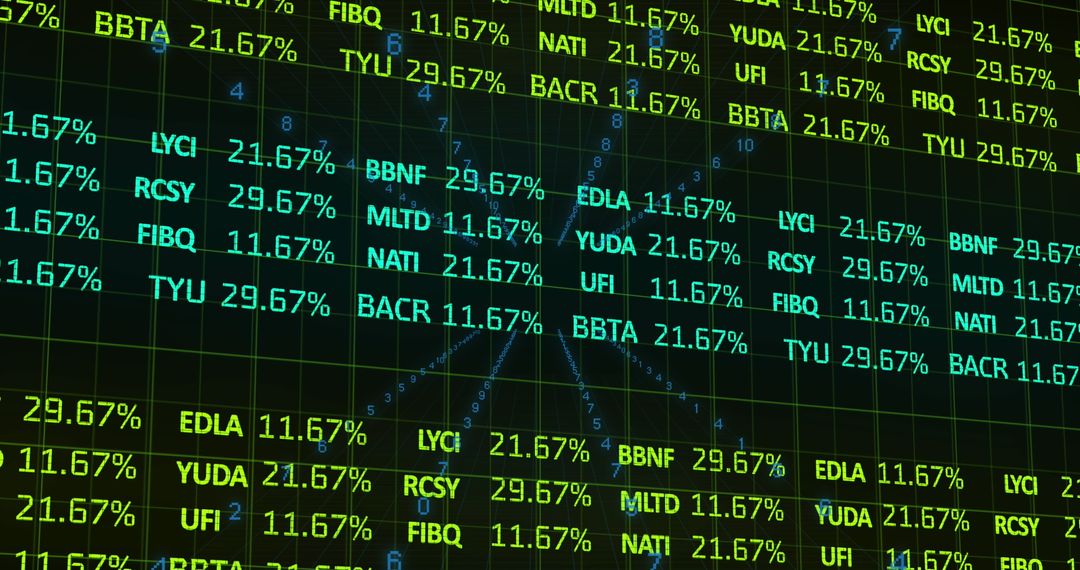
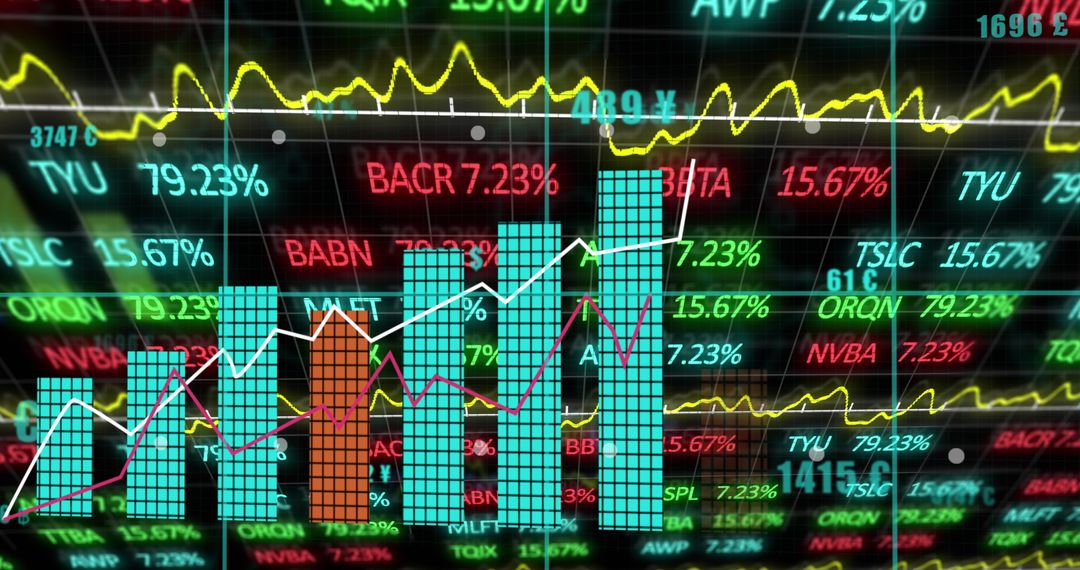
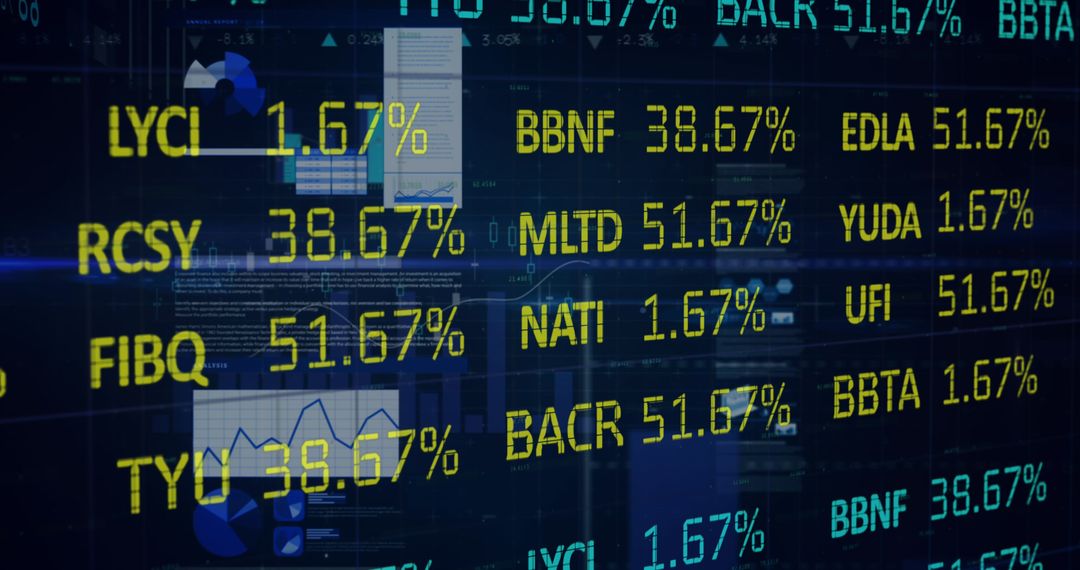
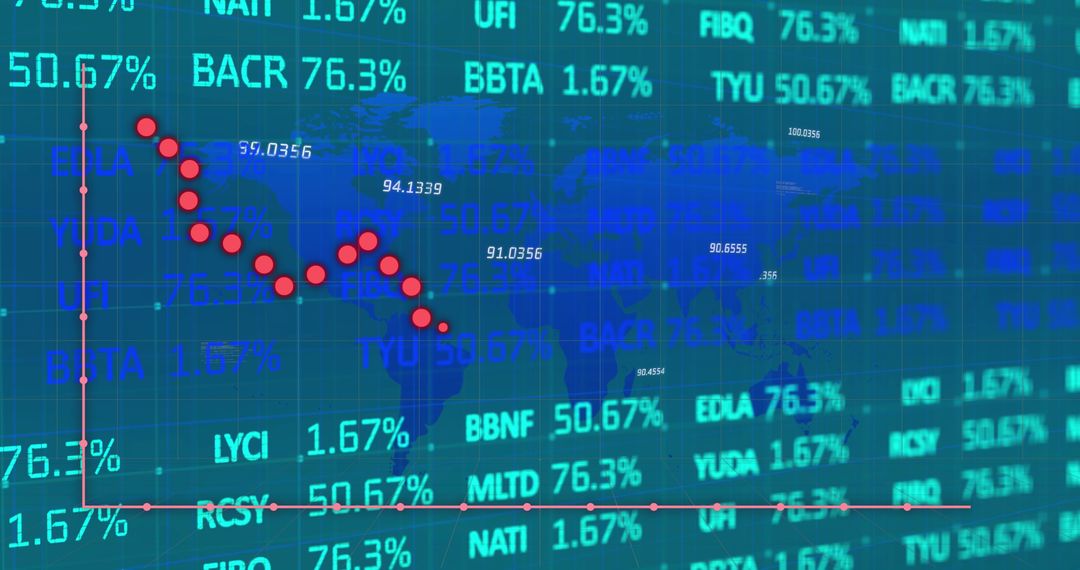
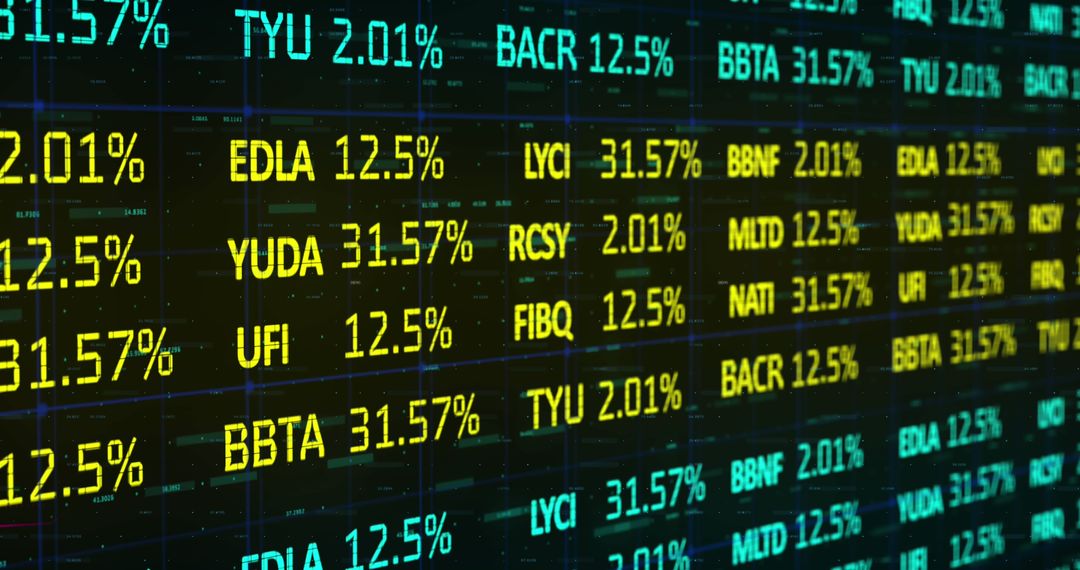
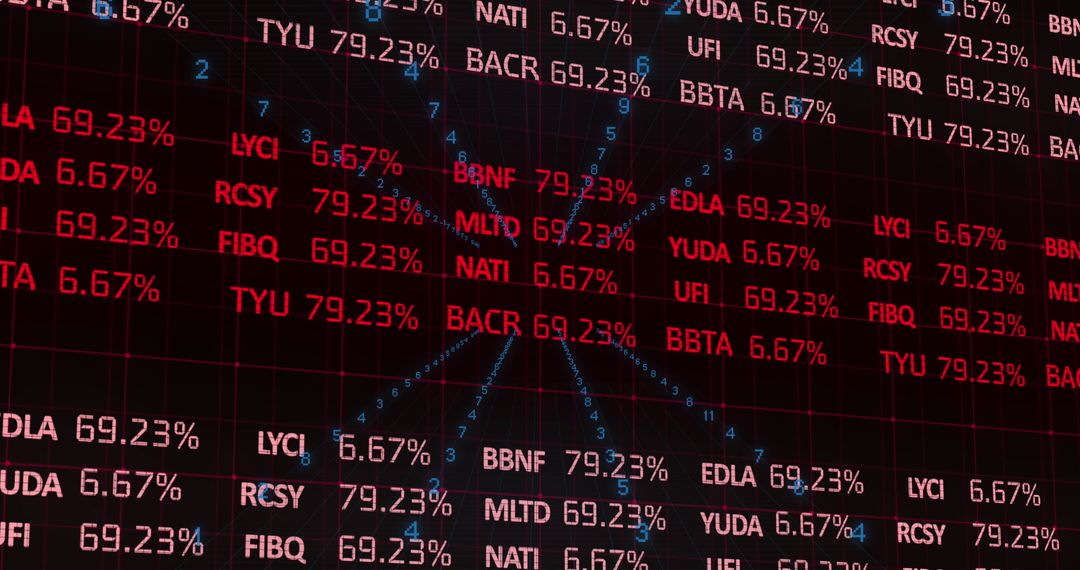
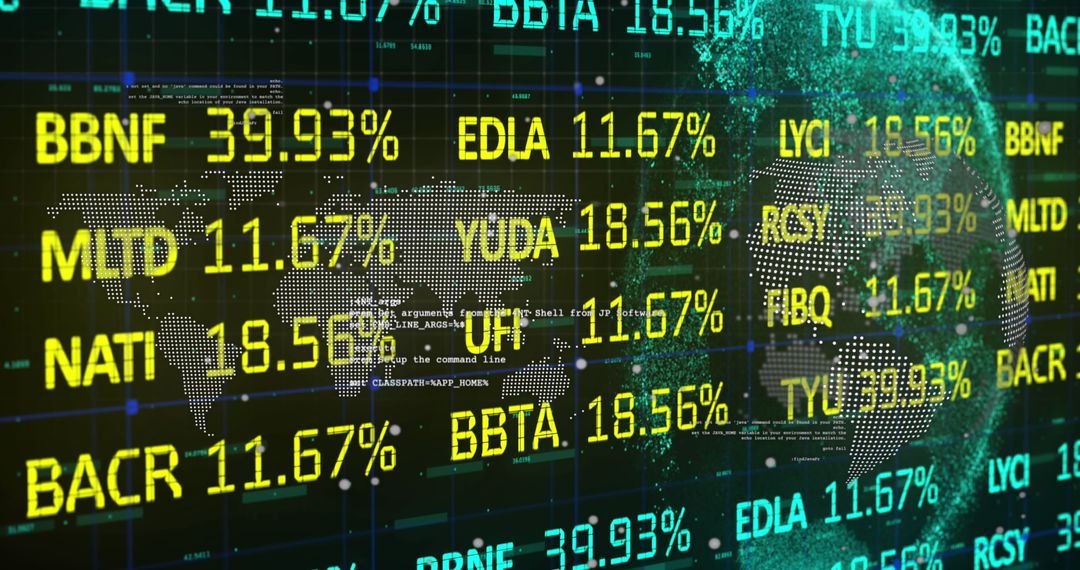
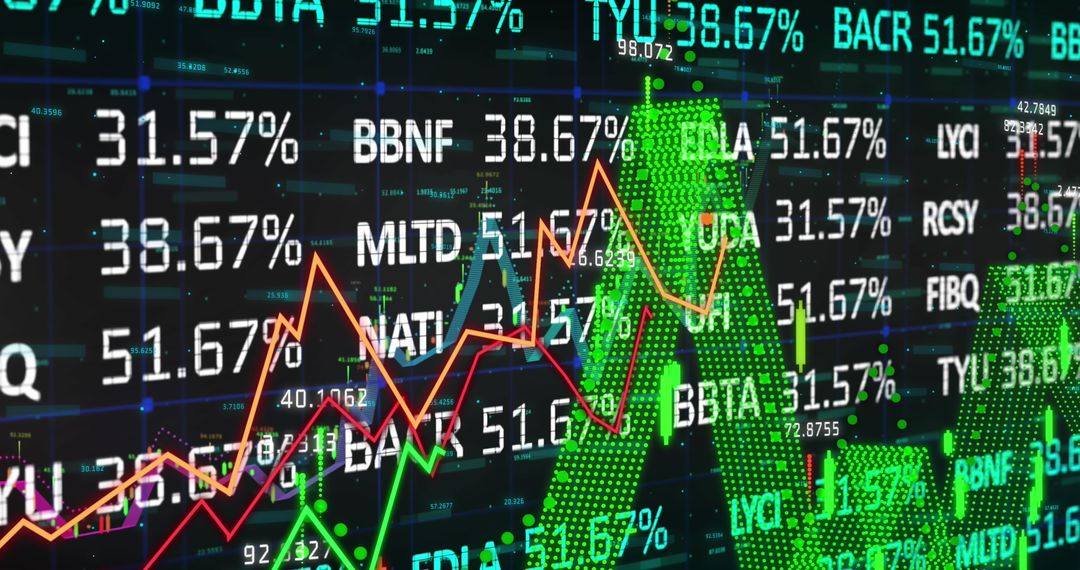
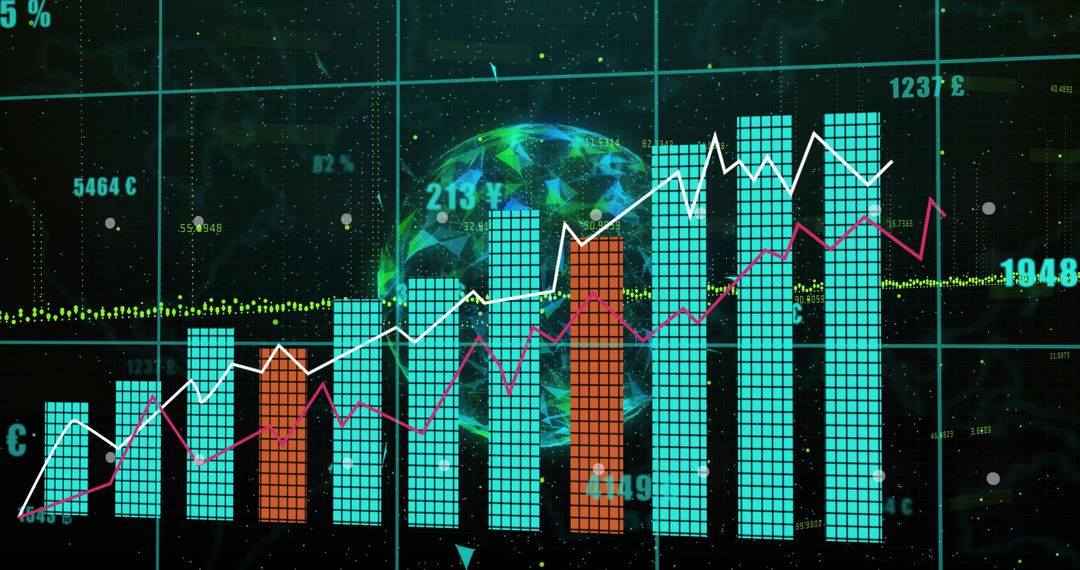
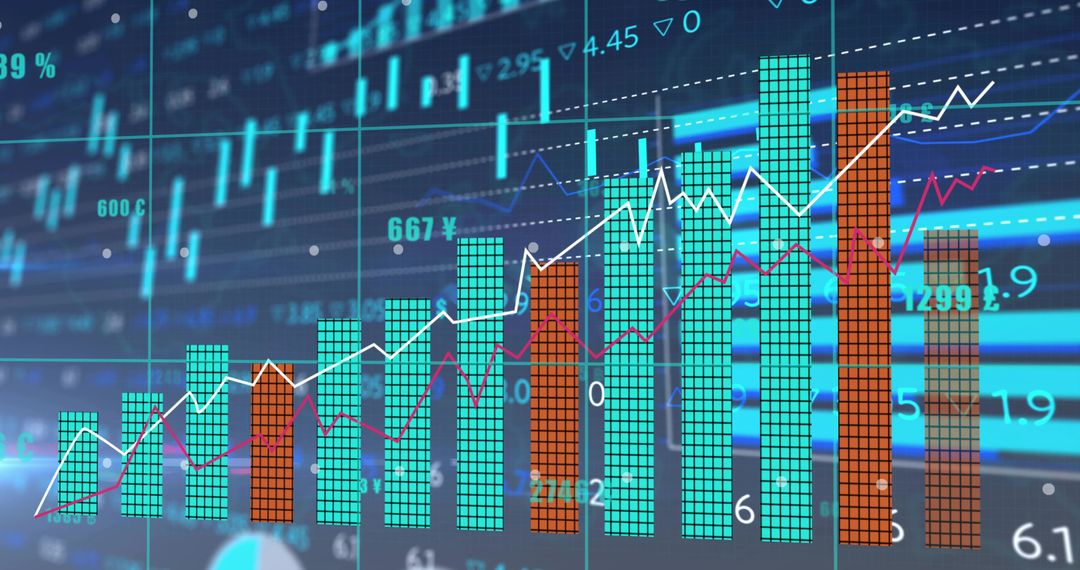
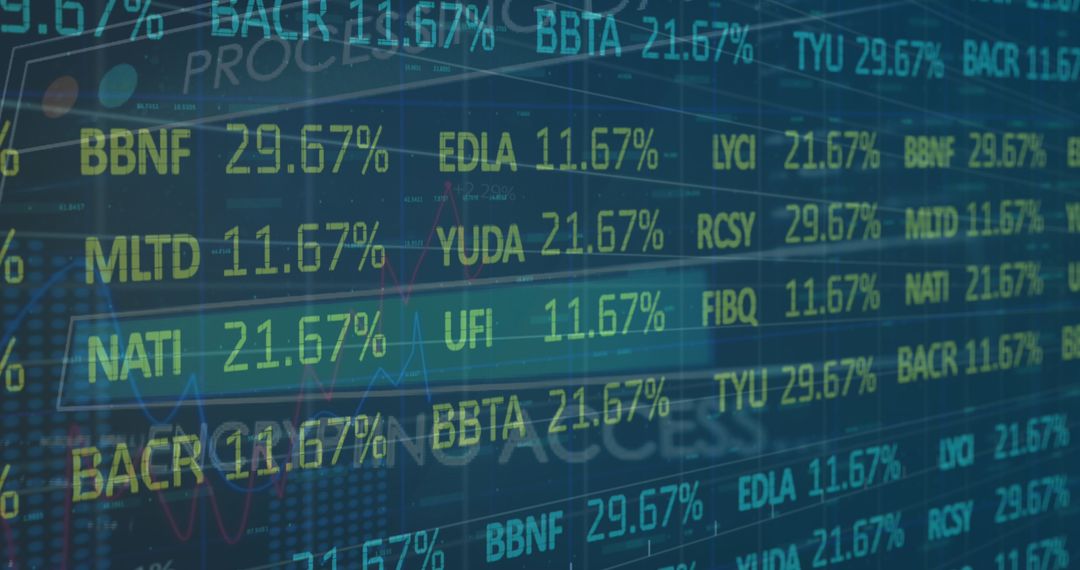
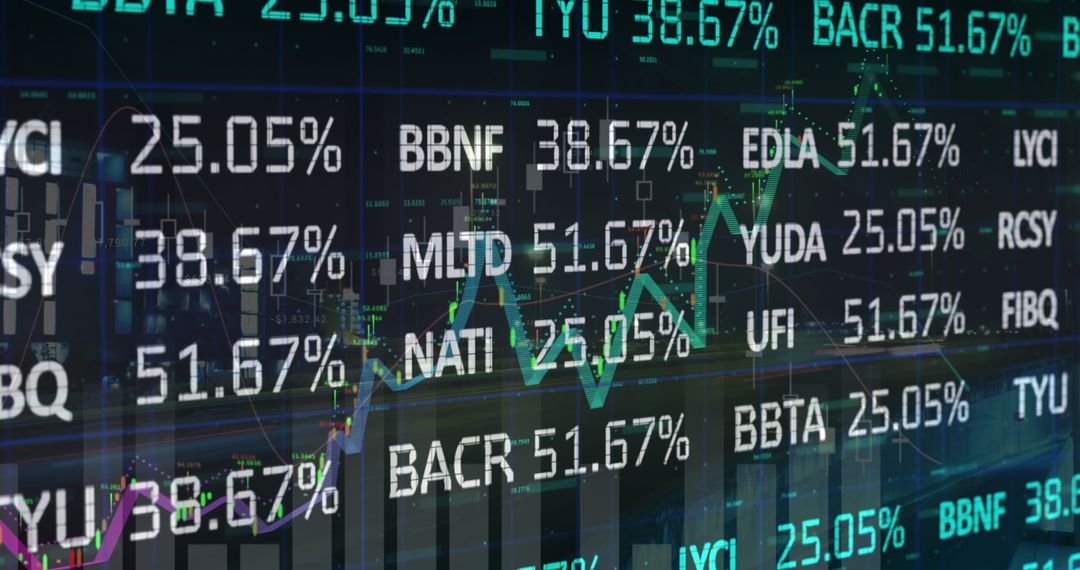
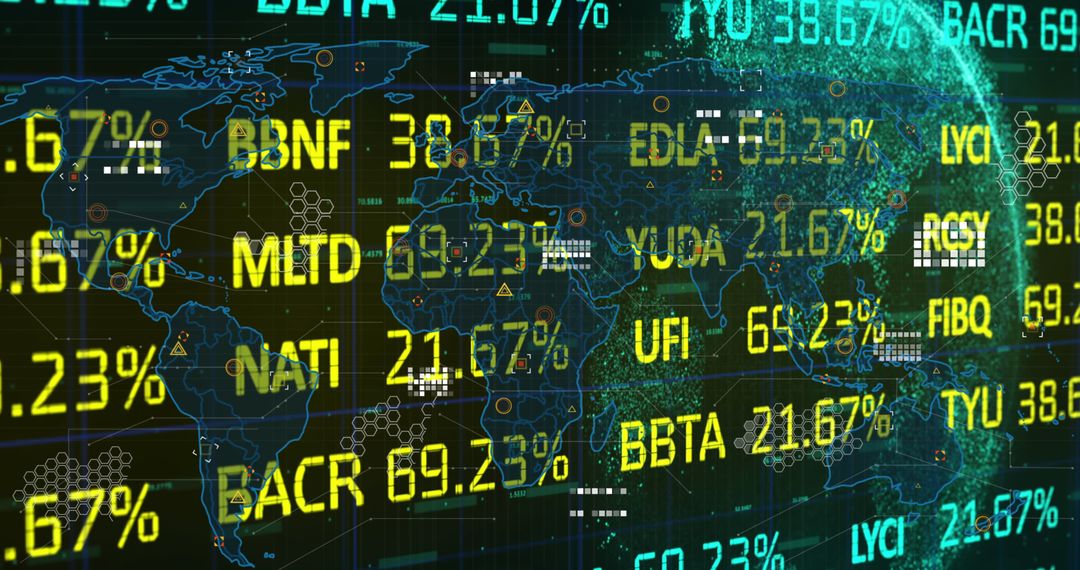
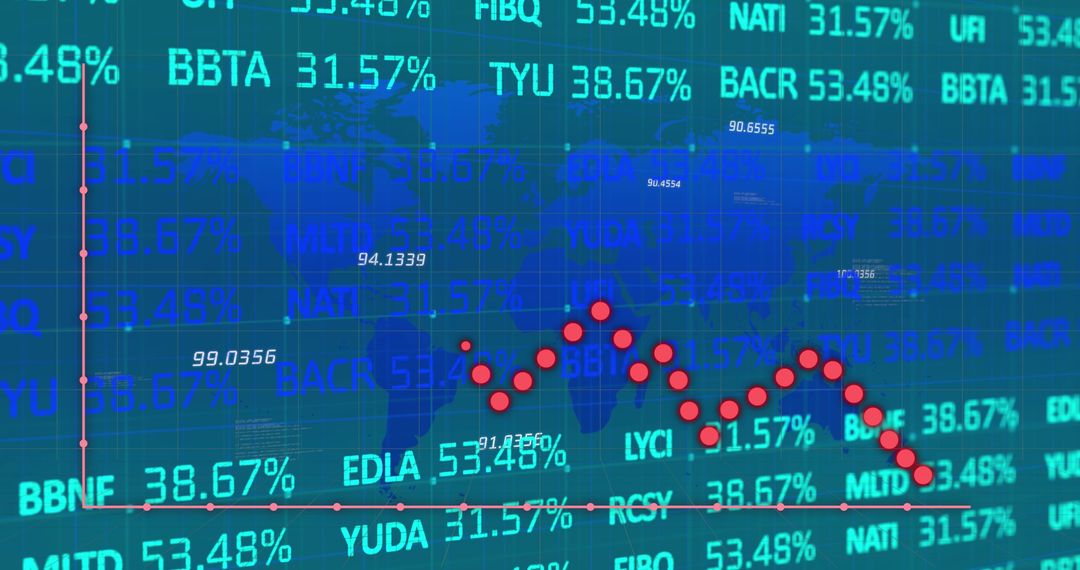
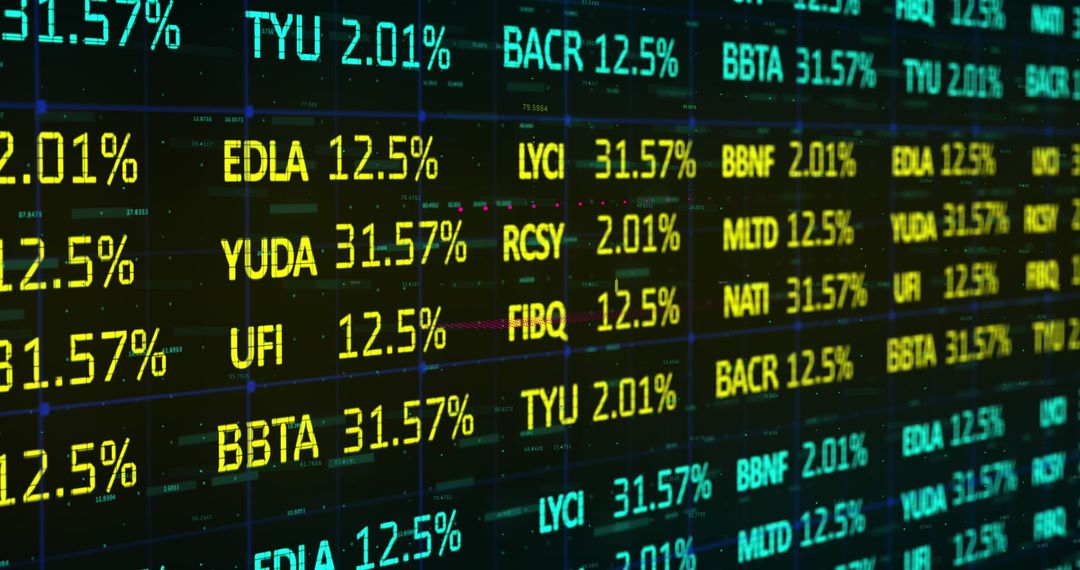
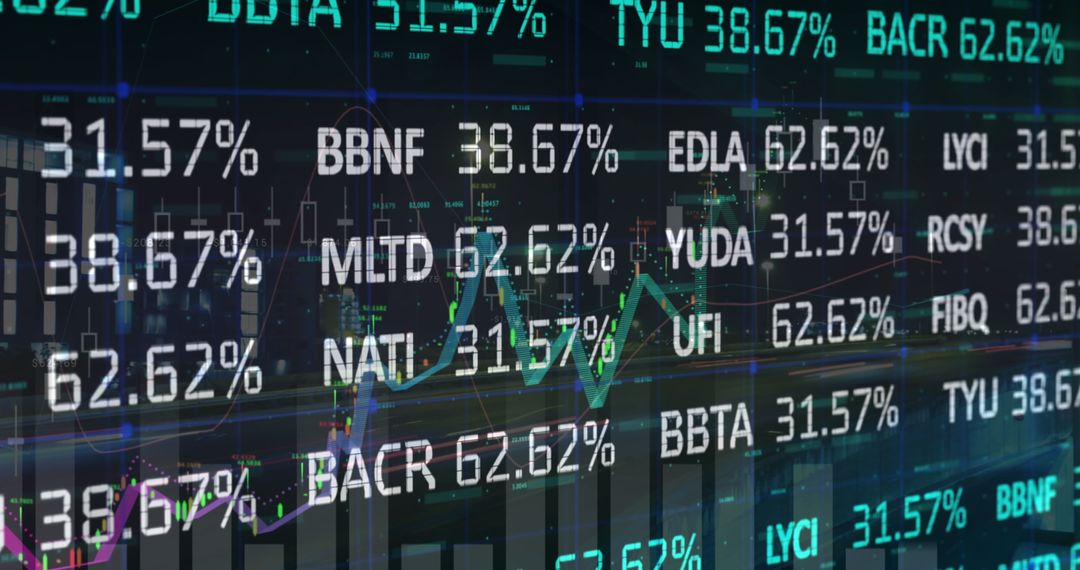
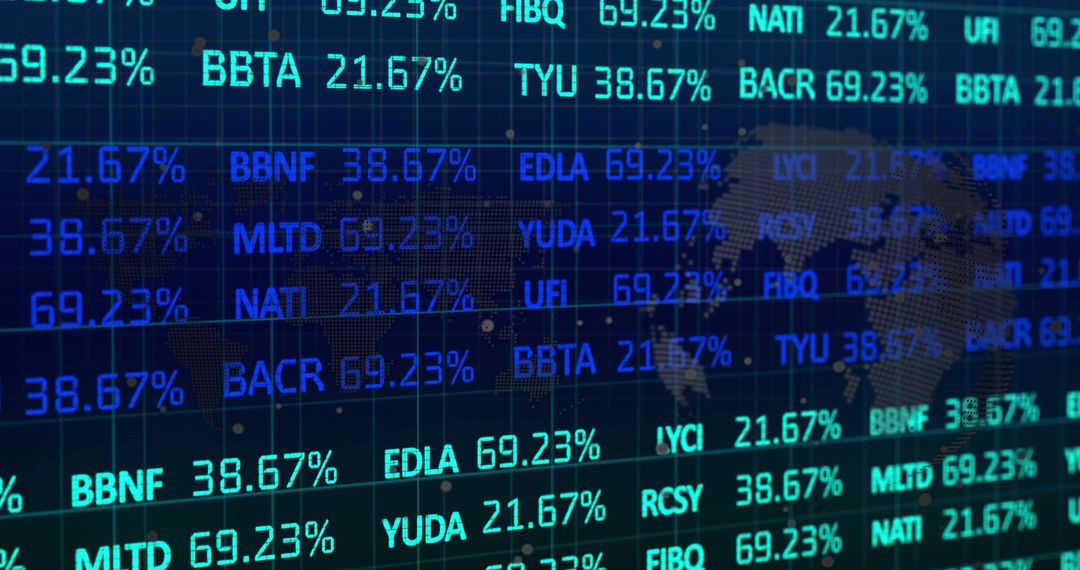
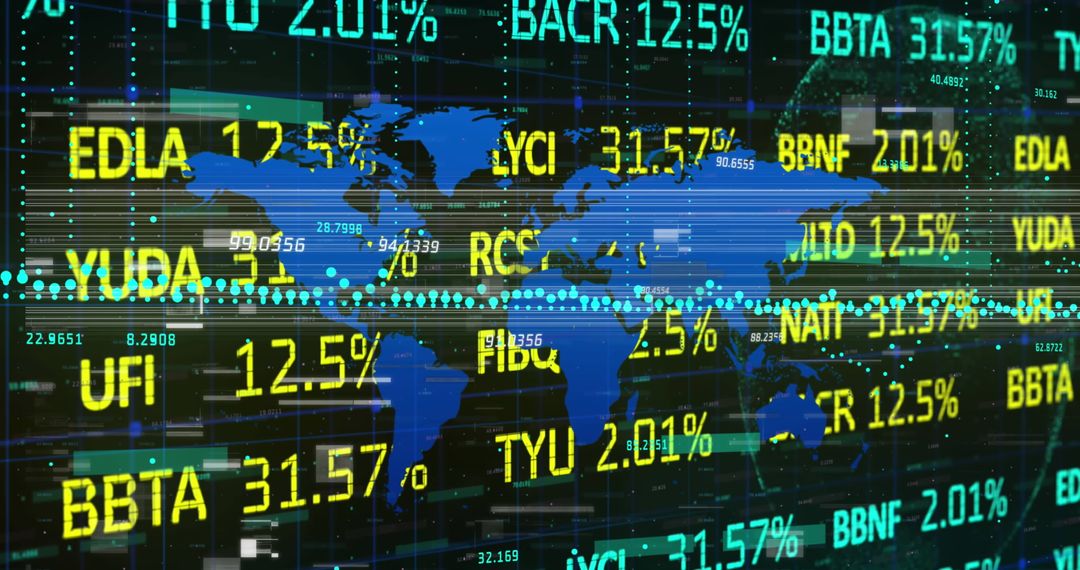
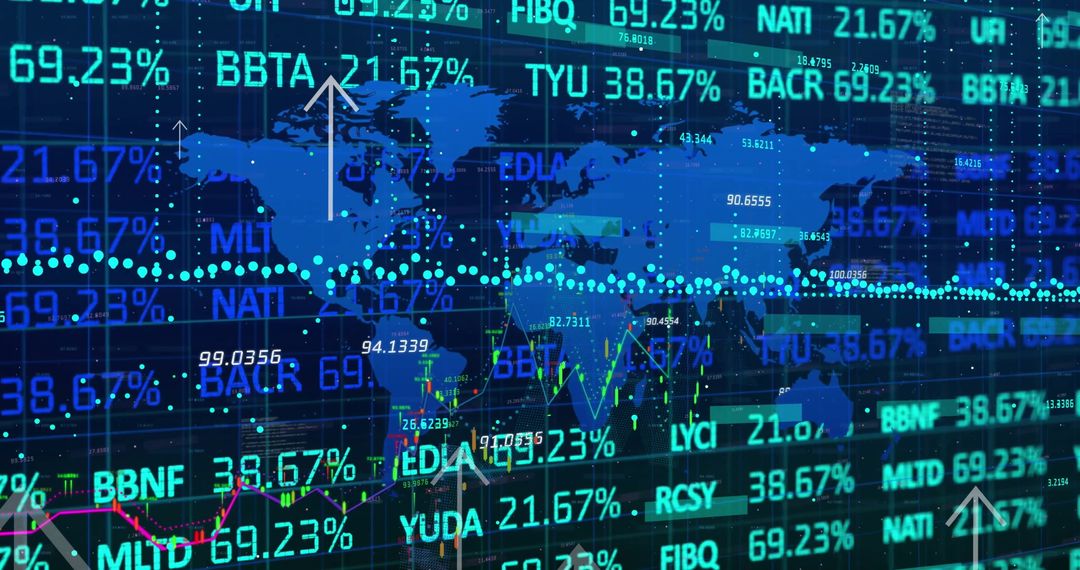
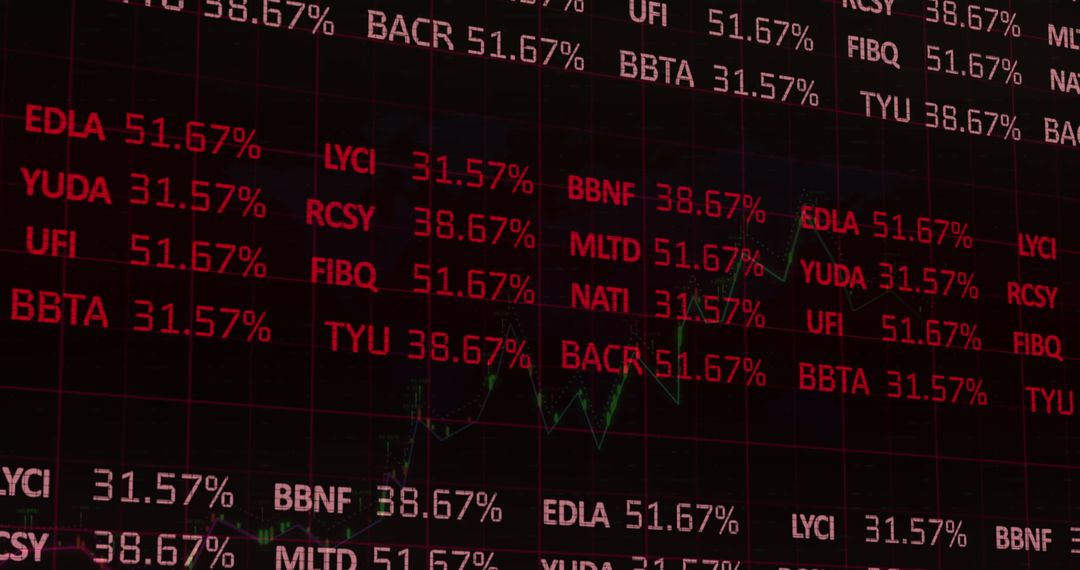
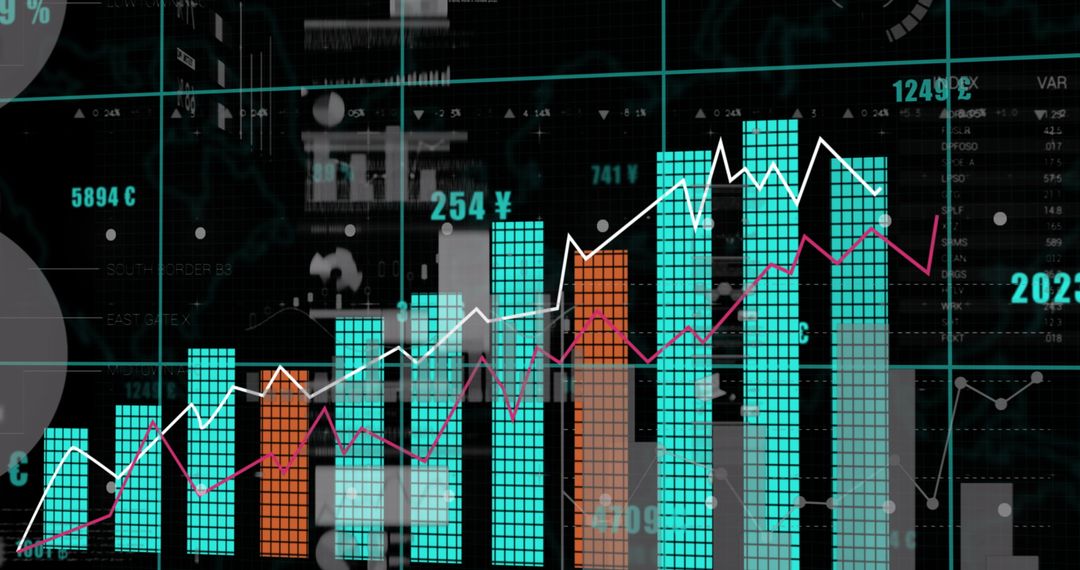
Brightly colored digital visualization of financial analytics combines both bar charts and trend lines to illustrate market performance, an indication of real-time trading data for investors and traders. Ideal for use in business presentations, financial news articles, tech advertising dealing with finance technology interfaces, or educational content on understanding market analysis and data trends.
Powered by  - Get 15% off with code: PIKWIZARD15


2
downloads
downloads
Tags:
More
Credit Photo
If you would like to credit the Photo, here are some ways you can do so
Text Link
photo Link
<span class="text-link">
<span>
<a target="_blank" href=https://pikwizard.com/photo/financial-market-analytics-on-digital-screen-with-trend-lines/a6d77af551cffbe7f9cc098ae9b3abc4/>PikWizard</a>
</span>
</span>
<span class="image-link">
<span
style="margin: 0 0 20px 0; display: inline-block; vertical-align: middle; width: 100%;"
>
<a
target="_blank"
href="https://pikwizard.com/photo/financial-market-analytics-on-digital-screen-with-trend-lines/a6d77af551cffbe7f9cc098ae9b3abc4/"
style="text-decoration: none; font-size: 10px; margin: 0;"
>
<img src="https://pikwizard.com/pw/medium/a6d77af551cffbe7f9cc098ae9b3abc4.jpg" style="margin: 0; width: 100%;" alt="" />
<p style="font-size: 12px; margin: 0;">PikWizard</p>
</a>
</span>
</span>
Free (free of charge)
Free for personal and commercial use.
Author: Authentic Images
Similar Free Stock Images

Premium


Premium


Premium


Premium


Premium

Premium


Premium


Premium


Premium


Premium


Premium


Premium


Premium


Premium


Premium


Premium


Premium


Premium


Premium

Premium


Premium


Premium


Premium


Premium