- Home >
- Stock Photos >
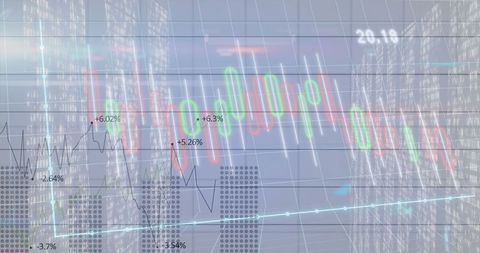
- Financial Market Chart with Candlestick Patterns and Trend Analysis
Financial Market Chart with Candlestick Patterns and Trend Analysis Image

Visual representing dynamic financial market data with illustrated candlestick chart, trend lines, and downward red arrow. Ideal for presentations, articles, and blogs focused on market trends, investment insights, and algorithmic trading strategies. Suitable for illustrating market data and analytics in educational or professional finance contexts.
Powered by 


2
downloads
downloads
Tags:
More
Credit Photo
If you would like to credit the Photo, here are some ways you can do so
Text Link
photo Link
<span class="text-link">
<span>
<a target="_blank" href=https://pikwizard.com/photo/financial-market-chart-with-candlestick-patterns-and-trend-analysis/0ea2d1e6c3f535a620ff6c9a71a1e738/>PikWizard</a>
</span>
</span>
<span class="image-link">
<span
style="margin: 0 0 20px 0; display: inline-block; vertical-align: middle; width: 100%;"
>
<a
target="_blank"
href="https://pikwizard.com/photo/financial-market-chart-with-candlestick-patterns-and-trend-analysis/0ea2d1e6c3f535a620ff6c9a71a1e738/"
style="text-decoration: none; font-size: 10px; margin: 0;"
>
<img src="https://pikwizard.com/pw/medium/0ea2d1e6c3f535a620ff6c9a71a1e738.jpg" style="margin: 0; width: 100%;" alt="" />
<p style="font-size: 12px; margin: 0;">PikWizard</p>
</a>
</span>
</span>
Free (free of charge)
Free for personal and commercial use.
Author: Creative Art
Similar Free Stock Images
Loading...