- Home >
- Stock Photos >
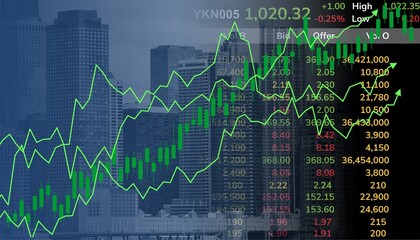
- Financial Market Data and Cityscape Blur Interface Concept
Financial Market Data and Cityscape Blur Interface Concept Image

Image depicts financial graphs and stock market data overlaying a blurred cityscape background, symbolizing business growth and modern digital trade environments. Useful for illustrating concepts related to global finance, economic analysis, or digital trading platforms in business presentations, articles, or technology websites.
Powered by 


2
downloads
downloads
Tags:
More
Credit Photo
If you would like to credit the Photo, here are some ways you can do so
Text Link
photo Link
<span class="text-link">
<span>
<a target="_blank" href=https://pikwizard.com/photo/financial-market-data-and-cityscape-blur-interface-concept/5c619f88ccb0a63359db0141d15ad779/>PikWizard</a>
</span>
</span>
<span class="image-link">
<span
style="margin: 0 0 20px 0; display: inline-block; vertical-align: middle; width: 100%;"
>
<a
target="_blank"
href="https://pikwizard.com/photo/financial-market-data-and-cityscape-blur-interface-concept/5c619f88ccb0a63359db0141d15ad779/"
style="text-decoration: none; font-size: 10px; margin: 0;"
>
<img src="https://pikwizard.com/pw/medium/5c619f88ccb0a63359db0141d15ad779.jpg" style="margin: 0; width: 100%;" alt="" />
<p style="font-size: 12px; margin: 0;">PikWizard</p>
</a>
</span>
</span>
Free (free of charge)
Free for personal and commercial use.
Author: People Creations
Similar Free Stock Images
Loading...

Premium


Premium

Premium


Premium


Premium

Premium


Premium


Premium


Premium


Premium


Premium


Premium


Premium


Premium

Premium


Premium
Premium


Premium


Premium

Premium


Premium


Premium


Premium


Premium


Premium