- Home >
- Stock Photos >
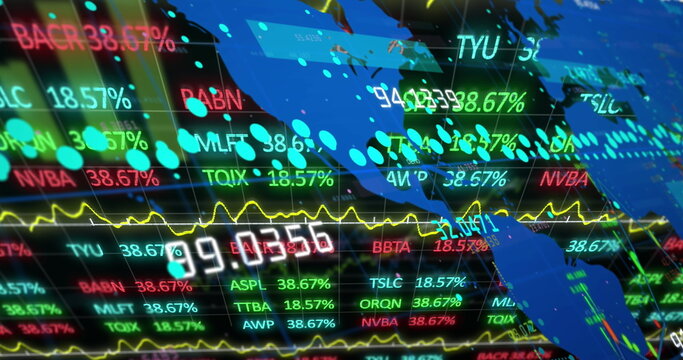
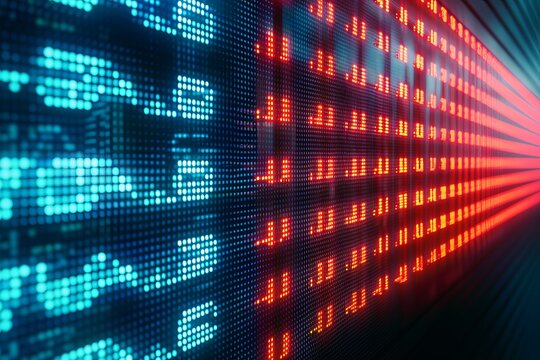
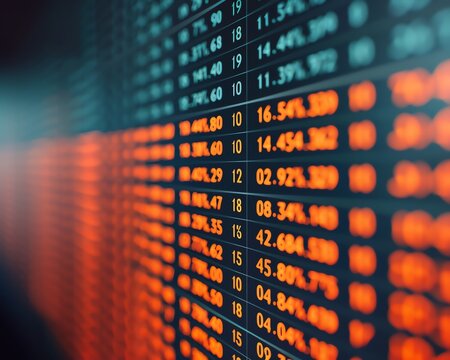
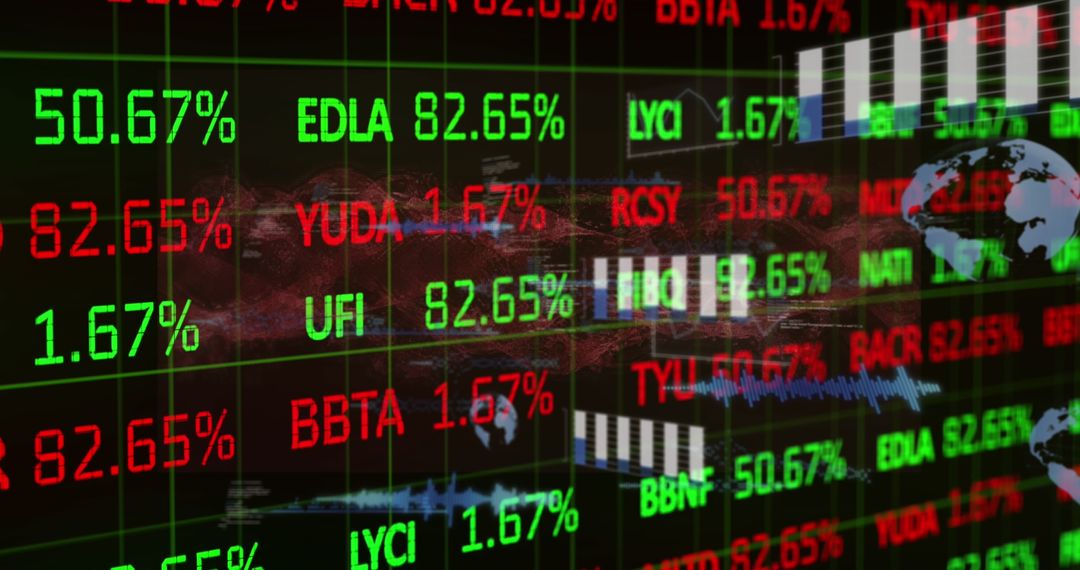
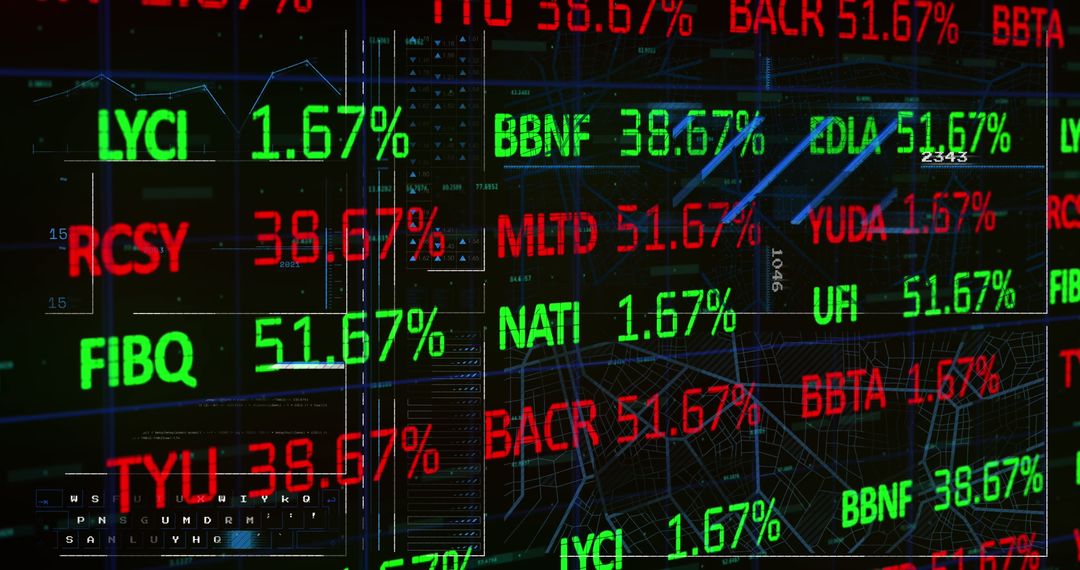
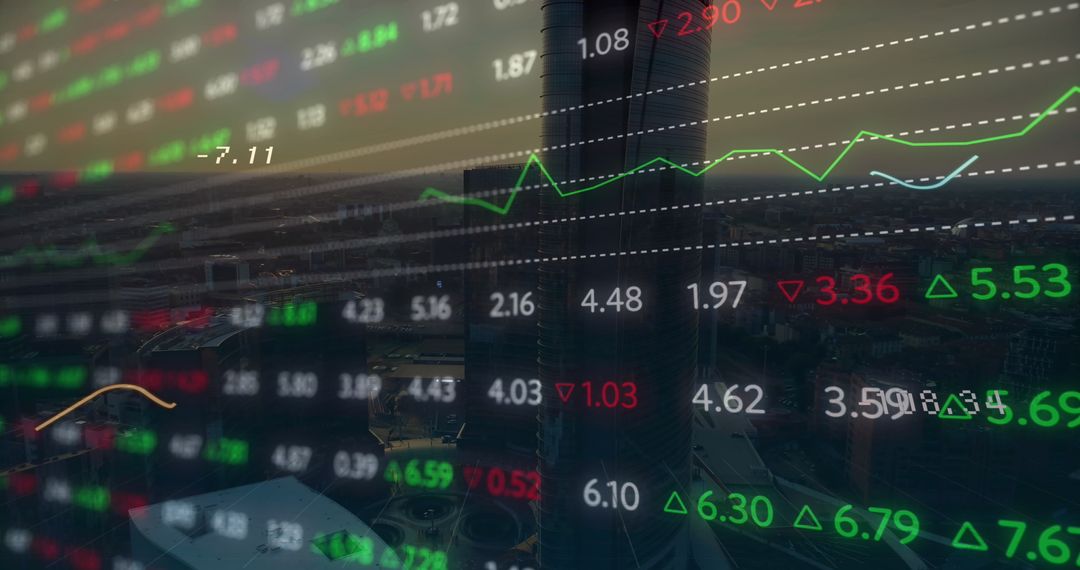
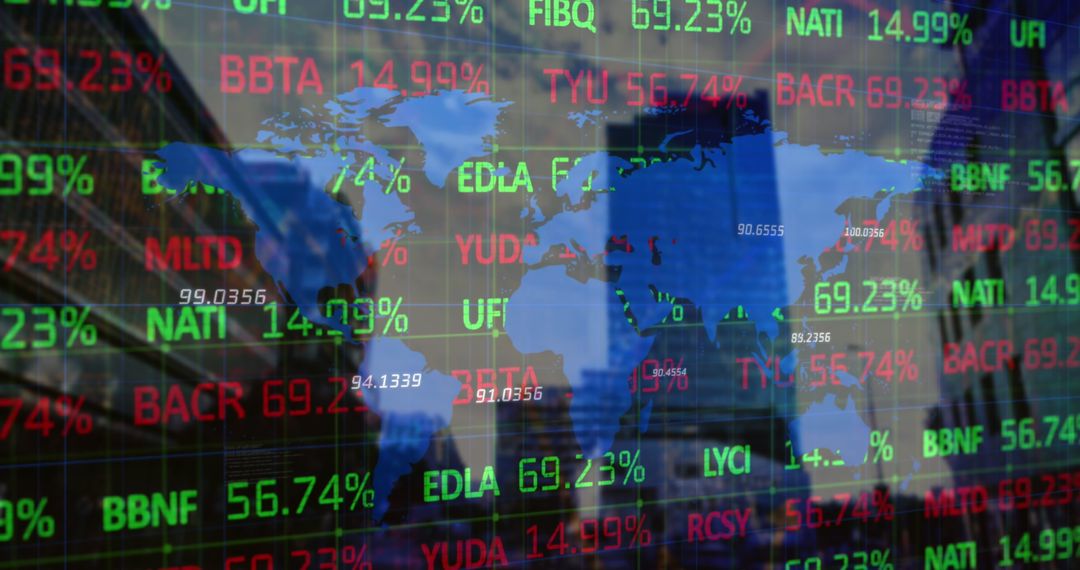
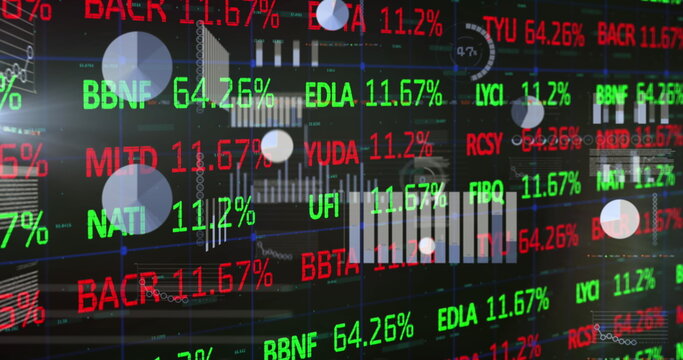
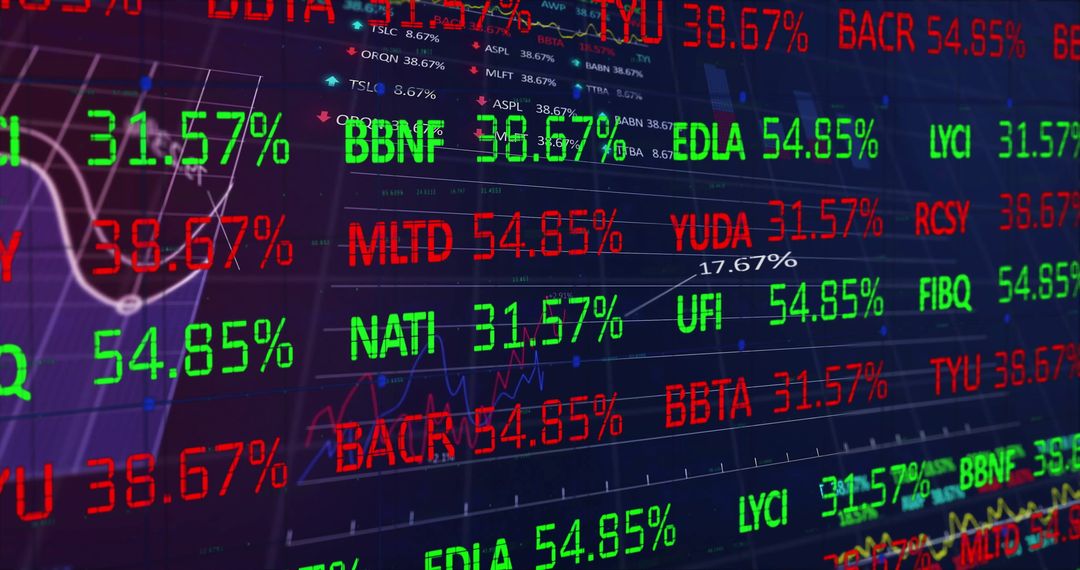
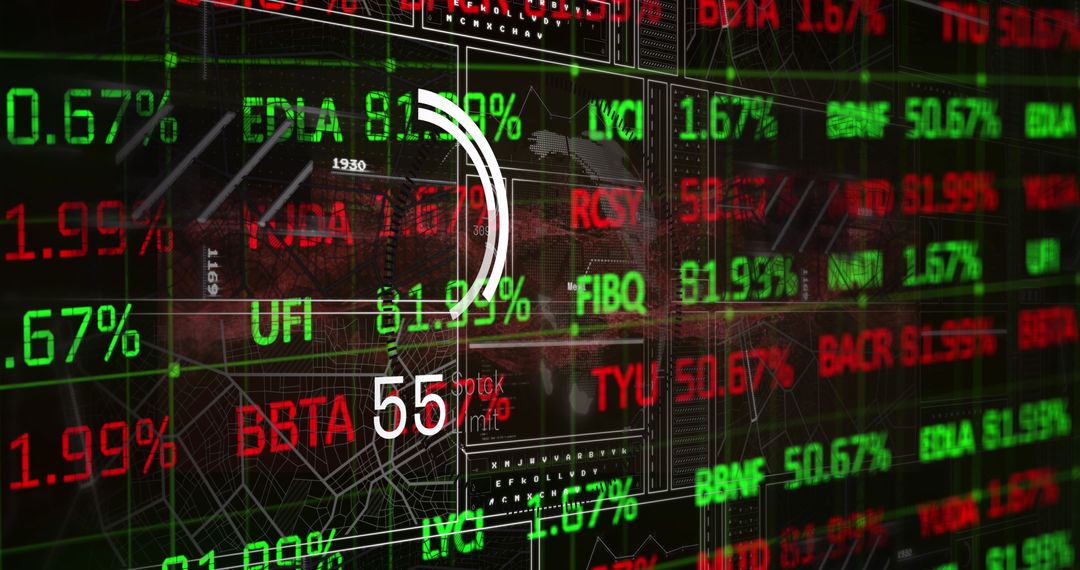
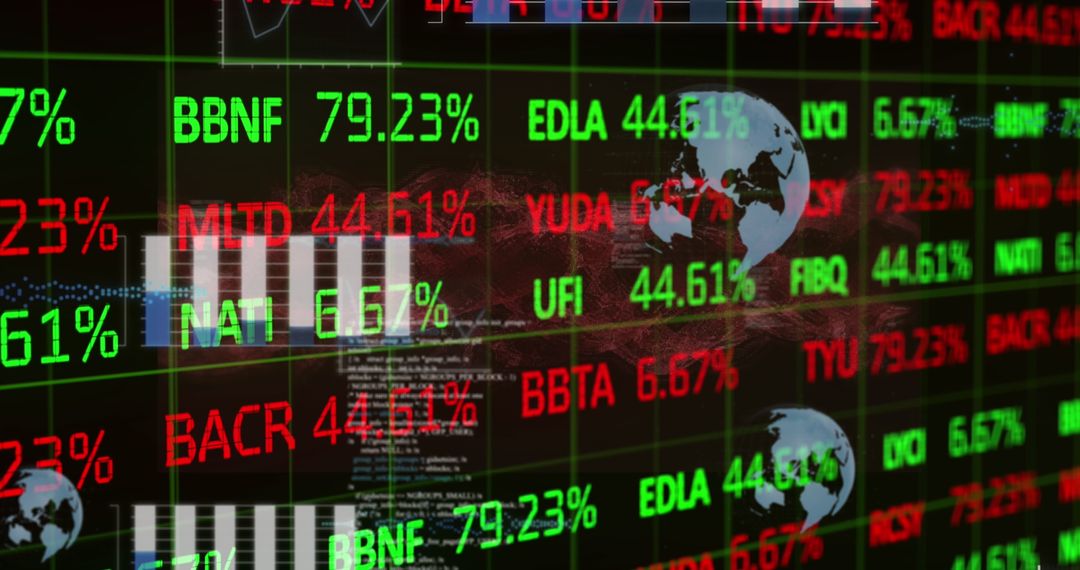
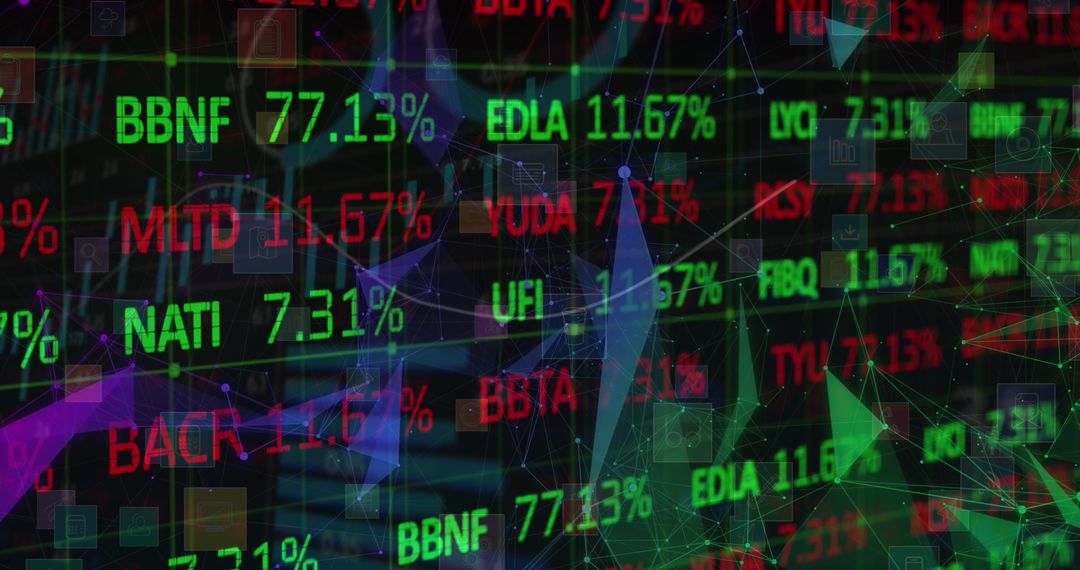
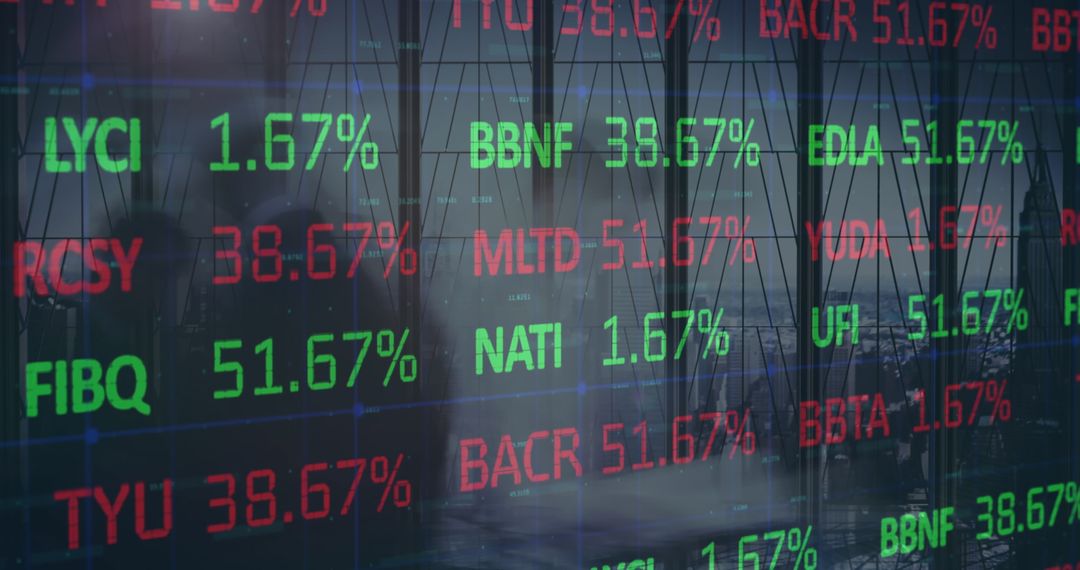
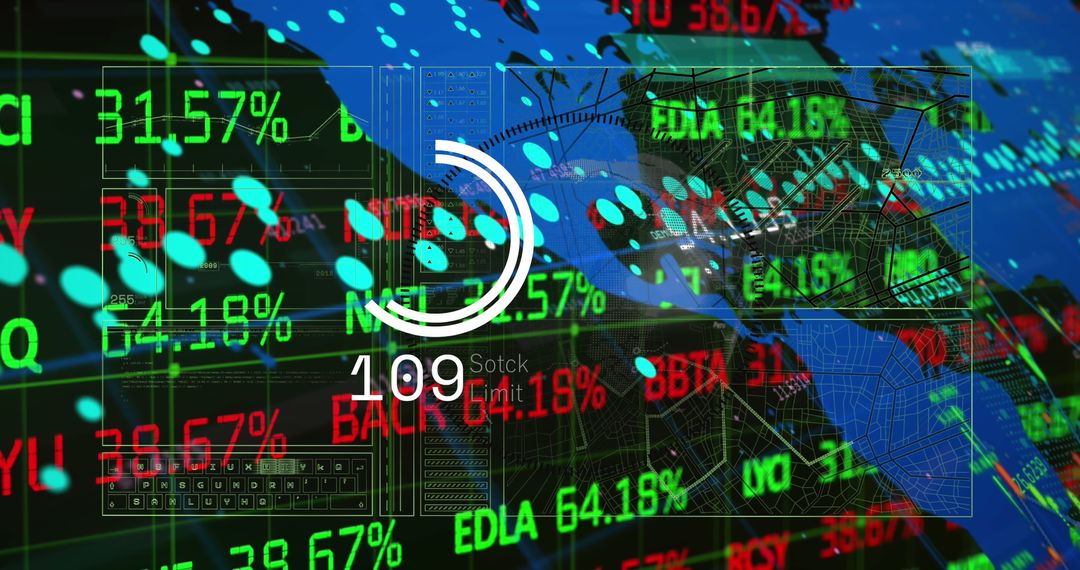
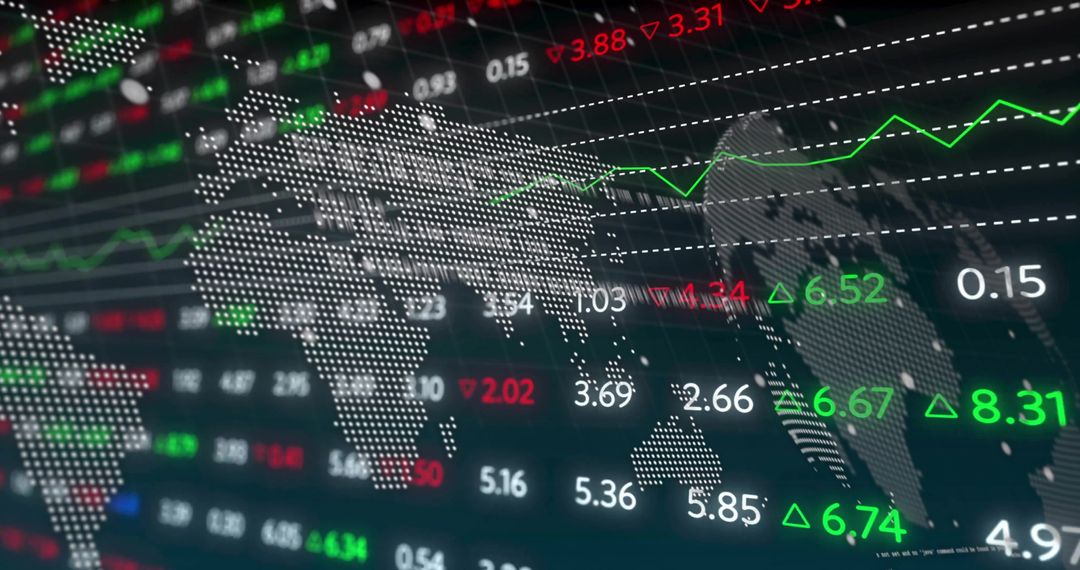
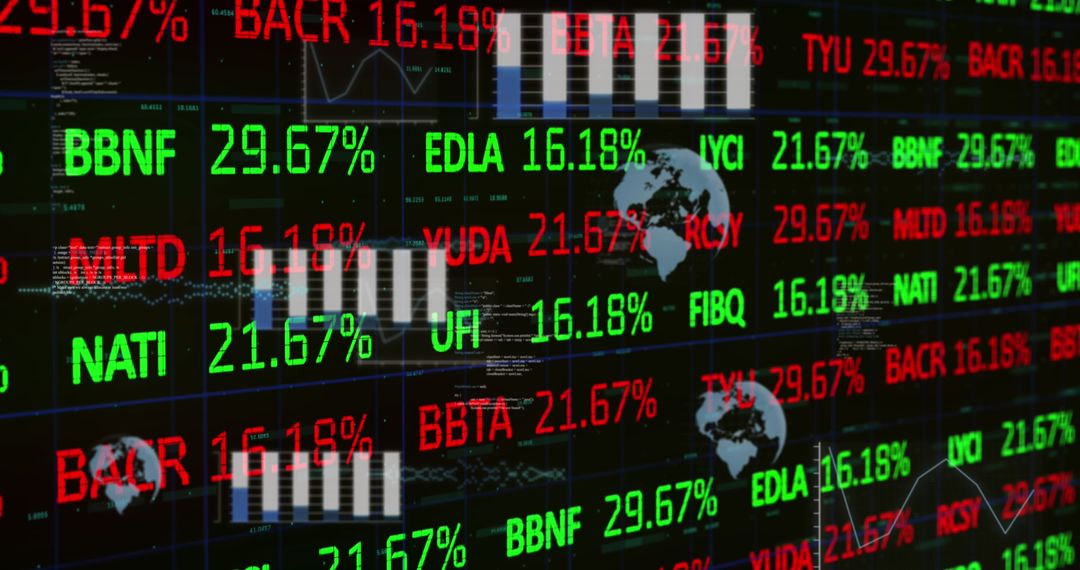
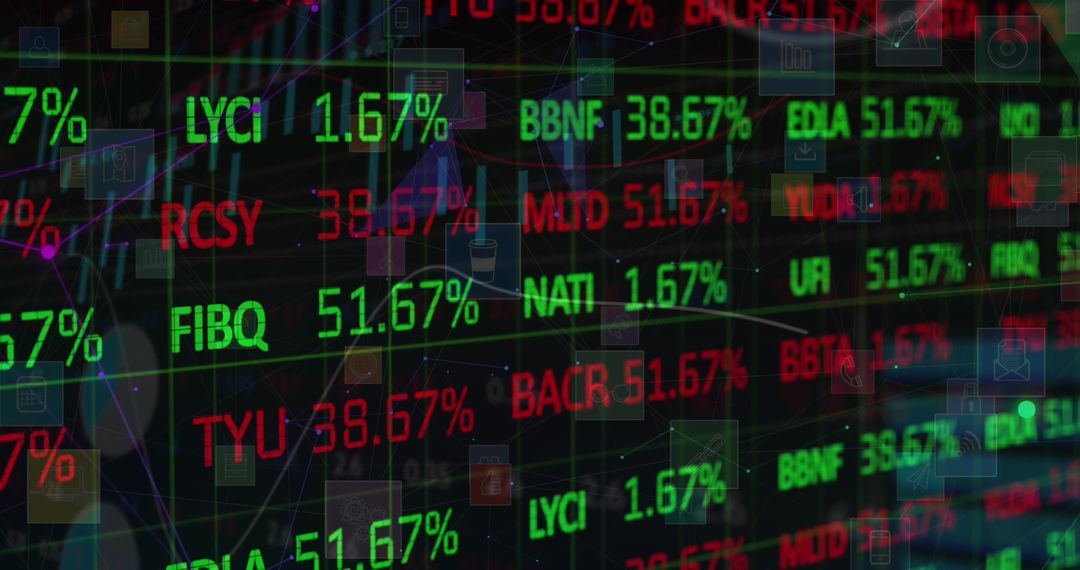
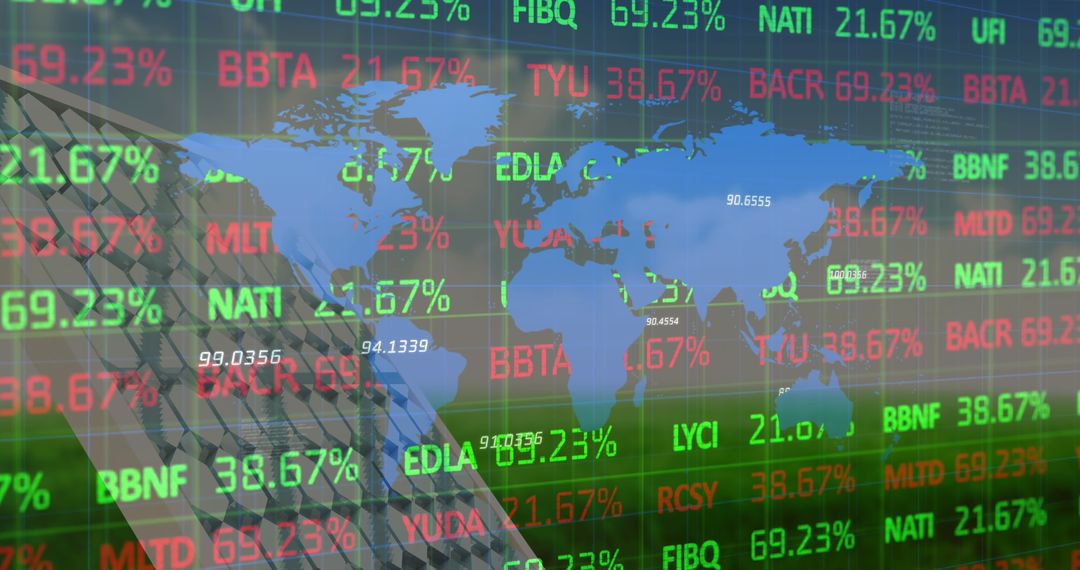
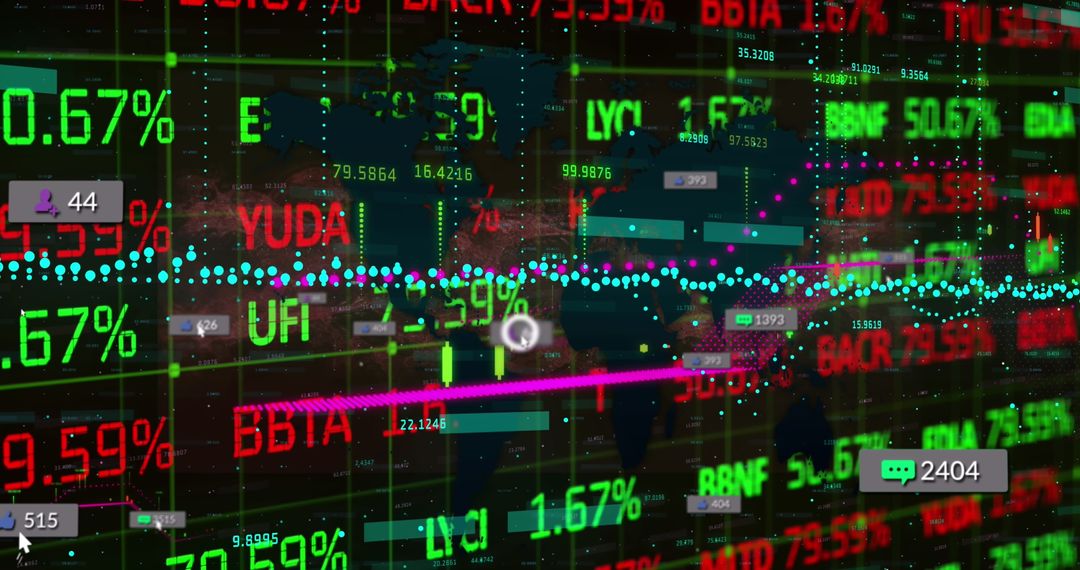
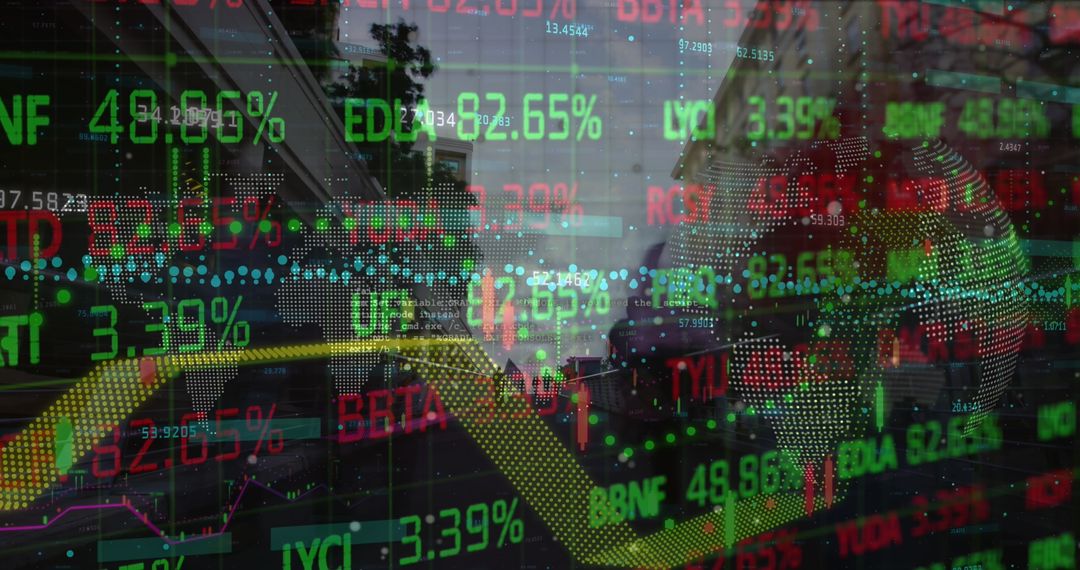
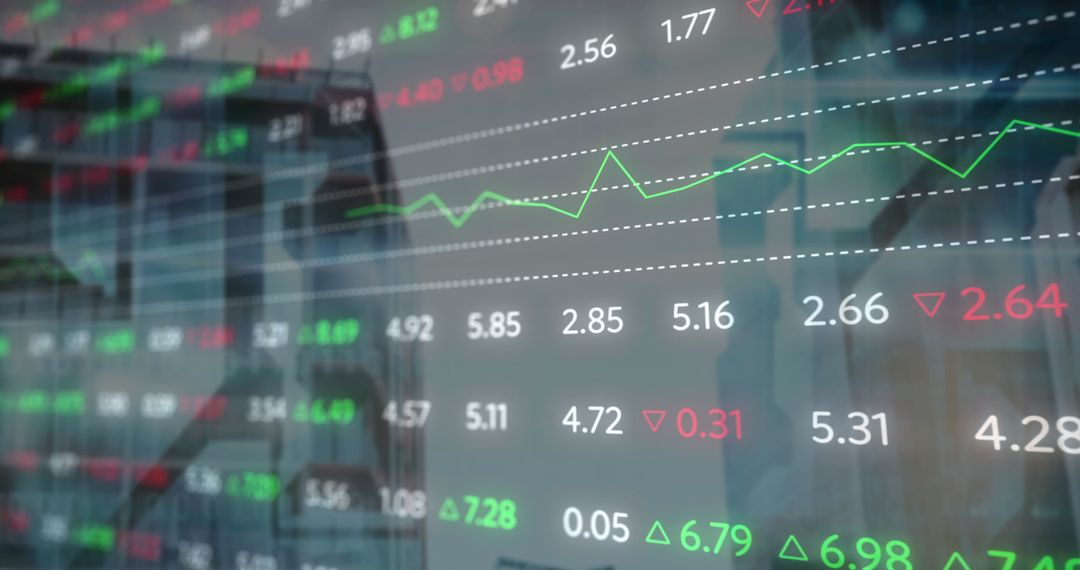
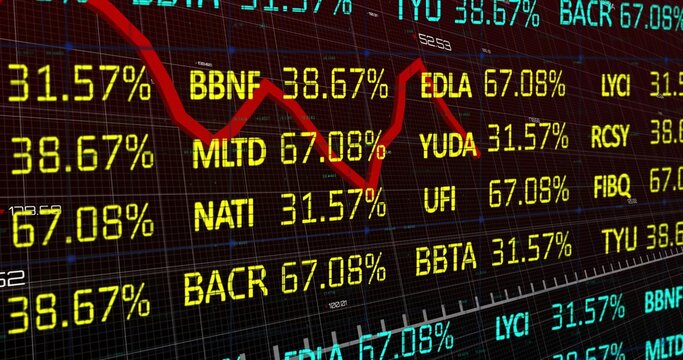
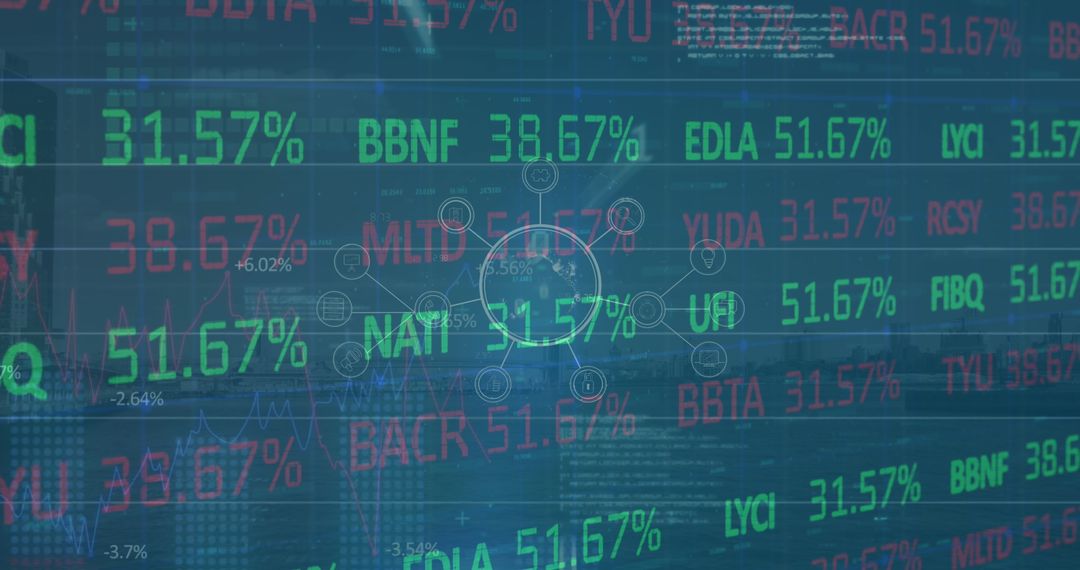
- Financial Market Data Dashboard With Ticker Symbols and Bar Charts
Financial Market Data Dashboard With Ticker Symbols and Bar Charts Image
This image depicting a financial trading dashboard shows dynamic market data and real-time updating ticker symbols accompanied by informative bar charts, indicating stock performance and analytics. Ideal for use in articles and presentations related to finance, investing, technological advancements in trade analytics, and data-driven business decisions. Perfect for blog posts on stock market trends, trading strategies, and financial planning.
Powered by 


2
downloads
downloads
Tags:
More
Credit Photo
If you would like to credit the Photo, here are some ways you can do so
Text Link
photo Link
<span class="text-link">
<span>
<a target="_blank" href=https://pikwizard.com/photo/financial-market-data-dashboard-with-ticker-symbols-and-bar-charts/c41be5e4f381d445537298fba6dab7b8/>PikWizard</a>
</span>
</span>
<span class="image-link">
<span
style="margin: 0 0 20px 0; display: inline-block; vertical-align: middle; width: 100%;"
>
<a
target="_blank"
href="https://pikwizard.com/photo/financial-market-data-dashboard-with-ticker-symbols-and-bar-charts/c41be5e4f381d445537298fba6dab7b8/"
style="text-decoration: none; font-size: 10px; margin: 0;"
>
<img src="https://pikwizard.com/pw/medium/c41be5e4f381d445537298fba6dab7b8.jpg" style="margin: 0; width: 100%;" alt="" />
<p style="font-size: 12px; margin: 0;">PikWizard</p>
</a>
</span>
</span>
Free (free of charge)
Free for personal and commercial use.
Author: People Creations
Similar Free Stock Images

Premium


Premium

Premium


Premium

Premium
Premium

Premium


Premium

Premium

Premium

Premium

Premium


Premium


Premium


Premium


Premium

Premium

Premium


Premium


Premium

Premium


Premium
Premium
Premium