
- Home >
- Stock Photos >
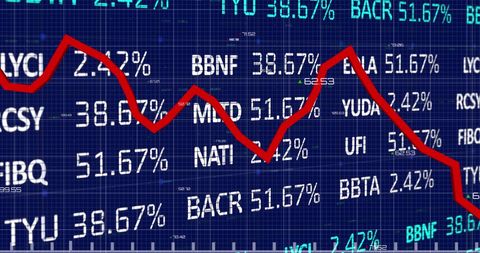
- Financial Market Data on Digital Interface with Declining Graph
Financial Market Data on Digital Interface with Declining Graph Image

This visualization showcases financial market data with a highlighted red graph representing a decline in stock prices. Global connectivity and technological advancements are symbolized by matrix-style data overlays and a digital globe in the background. Ideal for illustrating stock market trends, financial analysis reports, and technology in finance discussions.
Powered by 


downloads
Tags:
More
Credit Photo
If you would like to credit the Photo, here are some ways you can do so
Text Link
photo Link
<span class="text-link">
<span>
<a target="_blank" href=https://pikwizard.com/photo/financial-market-data-on-digital-interface-with-declining-graph/7e567529e2ec34710b0b4bc2c18728e5/>PikWizard</a>
</span>
</span>
<span class="image-link">
<span
style="margin: 0 0 20px 0; display: inline-block; vertical-align: middle; width: 100%;"
>
<a
target="_blank"
href="https://pikwizard.com/photo/financial-market-data-on-digital-interface-with-declining-graph/7e567529e2ec34710b0b4bc2c18728e5/"
style="text-decoration: none; font-size: 10px; margin: 0;"
>
<img src="https://pikwizard.com/pw/medium/7e567529e2ec34710b0b4bc2c18728e5.jpg" style="margin: 0; width: 100%;" alt="" />
<p style="font-size: 12px; margin: 0;">PikWizard</p>
</a>
</span>
</span>
Free (free of charge)
Free for personal and commercial use.
Author: Awesome Content
Similar Free Stock Images

Premium


Premium

Premium


Premium


Premium


Premium


Premium


Premium

Premium

Premium

Premium


Premium

Premium


Premium


Premium


Premium


Premium


Premium


Premium


Premium

Premium

Premium

Premium


Premium


Premium


Explore More Free Stock Images