- Home >
- Stock Photos >
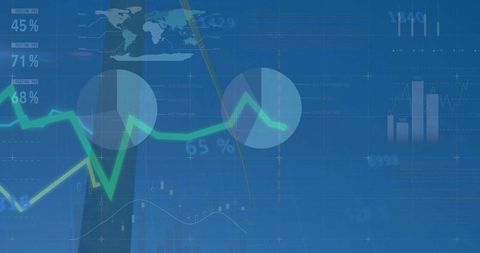
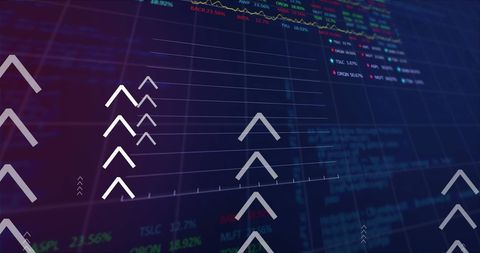
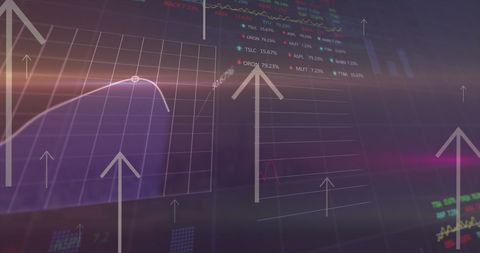
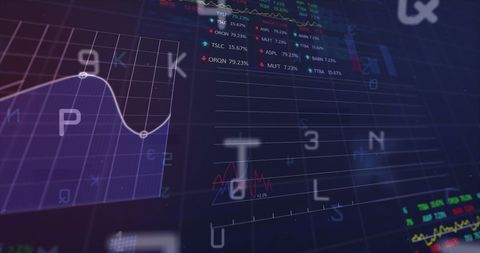
- Financial Market Data Processing with Global Network Interface
Financial Market Data Processing with Global Network Interface Image

This visual of financial data processing with charts and analytics on a digital grid exemplifies the dynamic landscape of global business. It can be used in contexts like educational resources, financial presentations, or articles relating to stock market analysis. Suitable for depicting advanced analytics in finance sectors, illustrating trends, and showcasing digital trading or consultations.

downloads
Tags:
More
Credit Photo
If you would like to credit the Photo, here are some ways you can do so
Text Link
photo Link
<span class="text-link">
<span>
<a target="_blank" href=https://pikwizard.com/photo/financial-market-data-processing-with-global-network-interface/b0e4b09df9d80f39feb0e4fa625be932/>PikWizard</a>
</span>
</span>
<span class="image-link">
<span
style="margin: 0 0 20px 0; display: inline-block; vertical-align: middle; width: 100%;"
>
<a
target="_blank"
href="https://pikwizard.com/photo/financial-market-data-processing-with-global-network-interface/b0e4b09df9d80f39feb0e4fa625be932/"
style="text-decoration: none; font-size: 10px; margin: 0;"
>
<img src="https://pikwizard.com/pw/medium/b0e4b09df9d80f39feb0e4fa625be932.jpg" style="margin: 0; width: 100%;" alt="" />
<p style="font-size: 12px; margin: 0;">PikWizard</p>
</a>
</span>
</span>
Free (free of charge)
Free for personal and commercial use.
Author: Awesome Content