- Home >
- Stock Photos >
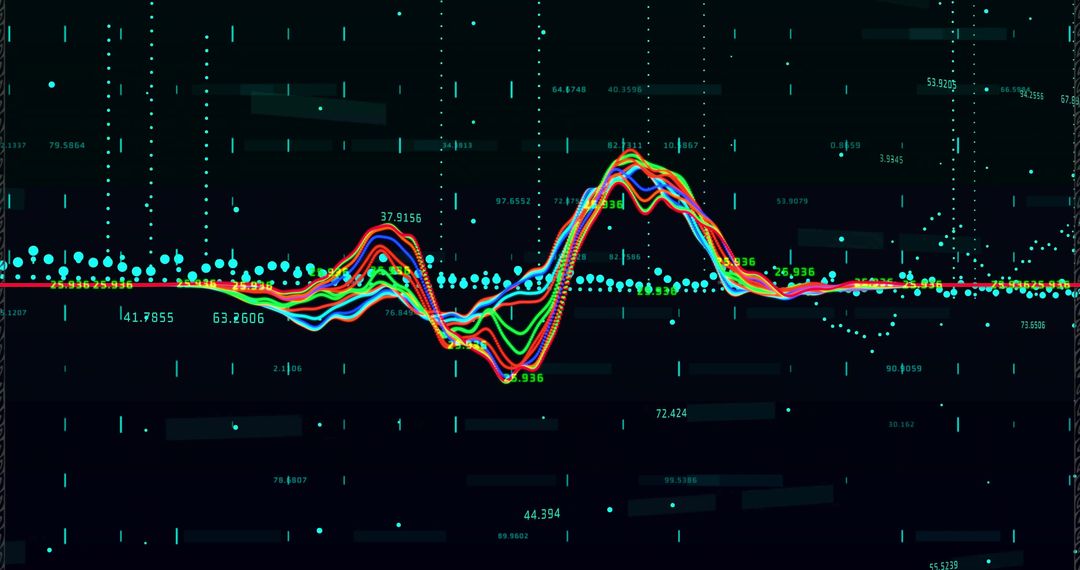
- Financial Market Data Visualization with Global Chart Overlay
Financial Market Data Visualization with Global Chart Overlay Image

Financial data visualization illustrates a digital graph showcasing global market trends and analytics. Suitable for use in articles, presentations, or reports on global finance, stock market analysis, economic studies, trade forecasting, and technological advancements in data processing. Ideal for financial news platforms, business websites, and educational materials in finance and technology subjects.
Powered by 


2
downloads
downloads
Tags:
More
Credit Photo
If you would like to credit the Photo, here are some ways you can do so
Text Link
photo Link
<span class="text-link">
<span>
<a target="_blank" href=https://pikwizard.com/photo/financial-market-data-visualization-with-global-chart-overlay/8ed3ce72a841493e747107abcf1573b9/>PikWizard</a>
</span>
</span>
<span class="image-link">
<span
style="margin: 0 0 20px 0; display: inline-block; vertical-align: middle; width: 100%;"
>
<a
target="_blank"
href="https://pikwizard.com/photo/financial-market-data-visualization-with-global-chart-overlay/8ed3ce72a841493e747107abcf1573b9/"
style="text-decoration: none; font-size: 10px; margin: 0;"
>
<img src="https://pikwizard.com/pw/medium/8ed3ce72a841493e747107abcf1573b9.jpg" style="margin: 0; width: 100%;" alt="" />
<p style="font-size: 12px; margin: 0;">PikWizard</p>
</a>
</span>
</span>
Free (free of charge)
Free for personal and commercial use.
Author: People Creations
Similar Free Stock Images

Premium


Premium


Premium


Premium


Premium


Premium


Premium


Premium


Premium


Premium


Premium


Premium


Premium


Premium


Premium


Premium


Premium


Premium


Premium


Premium


Premium


Premium


Premium


Premium