- Home >
- Stock Photos >
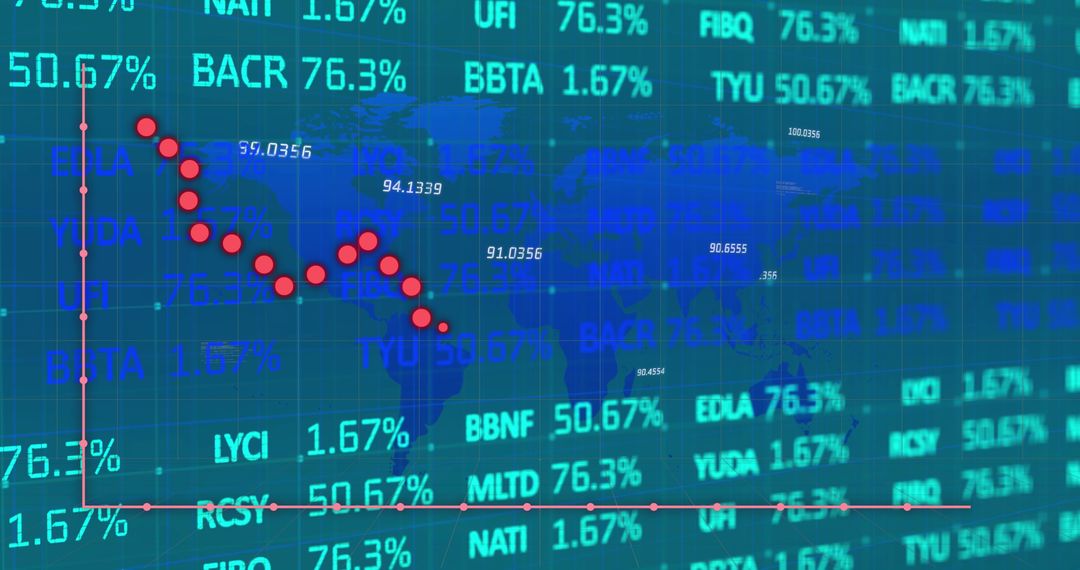
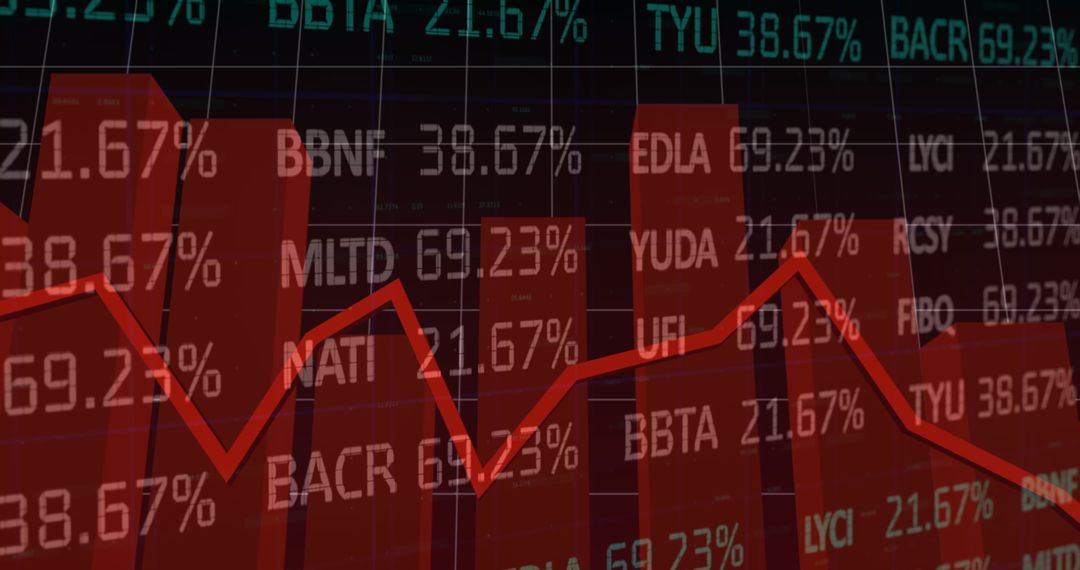
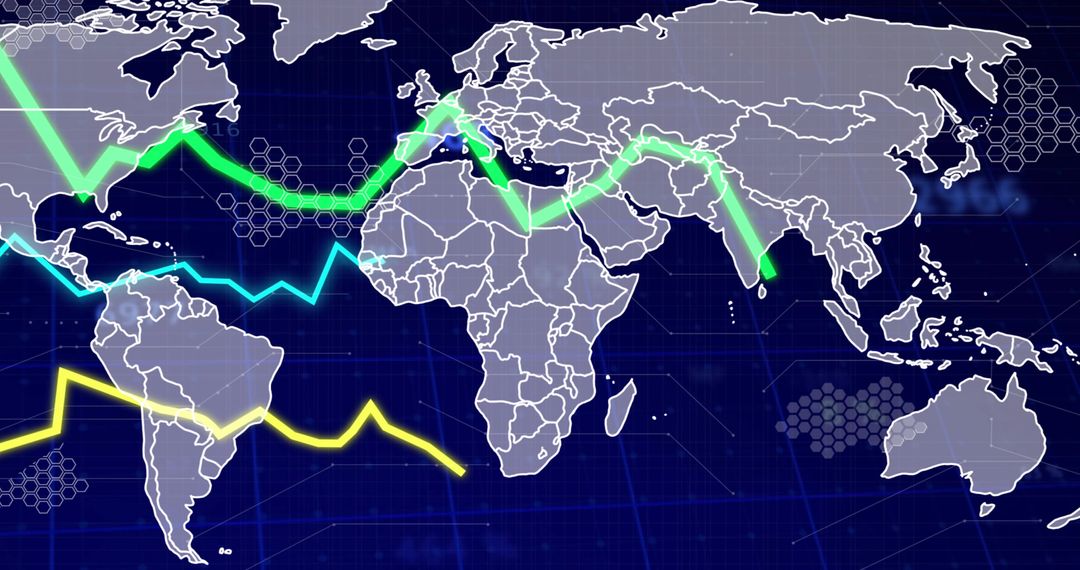
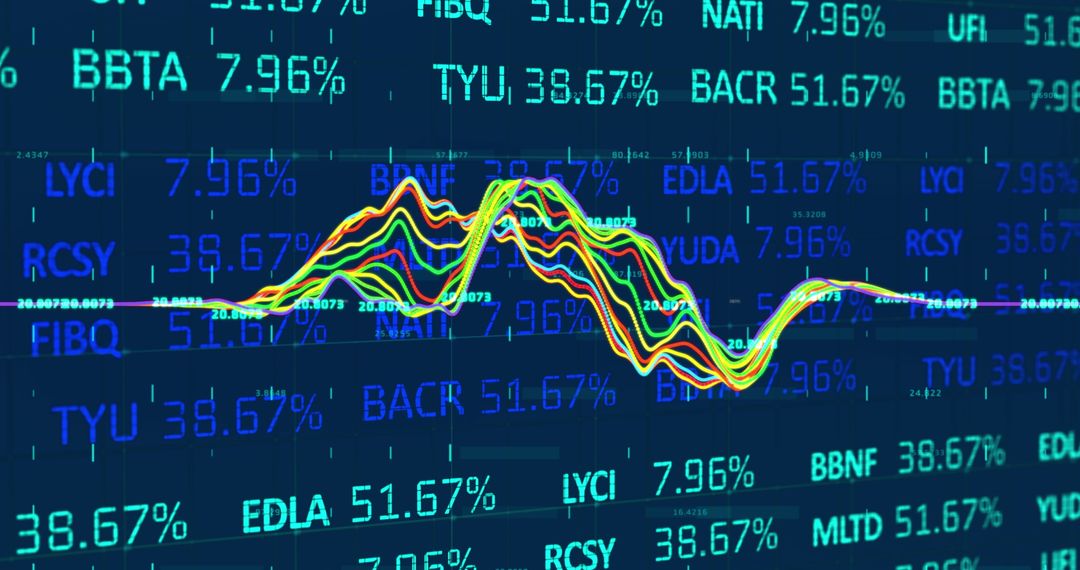
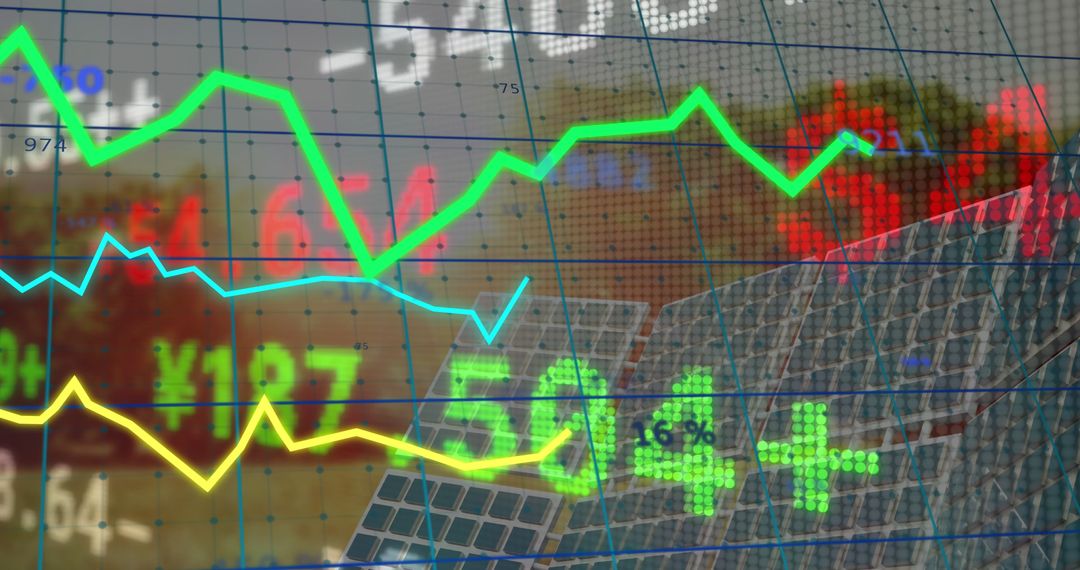
- Financial Market Data with Global Connectivity
Financial Market Data with Global Connectivity Image

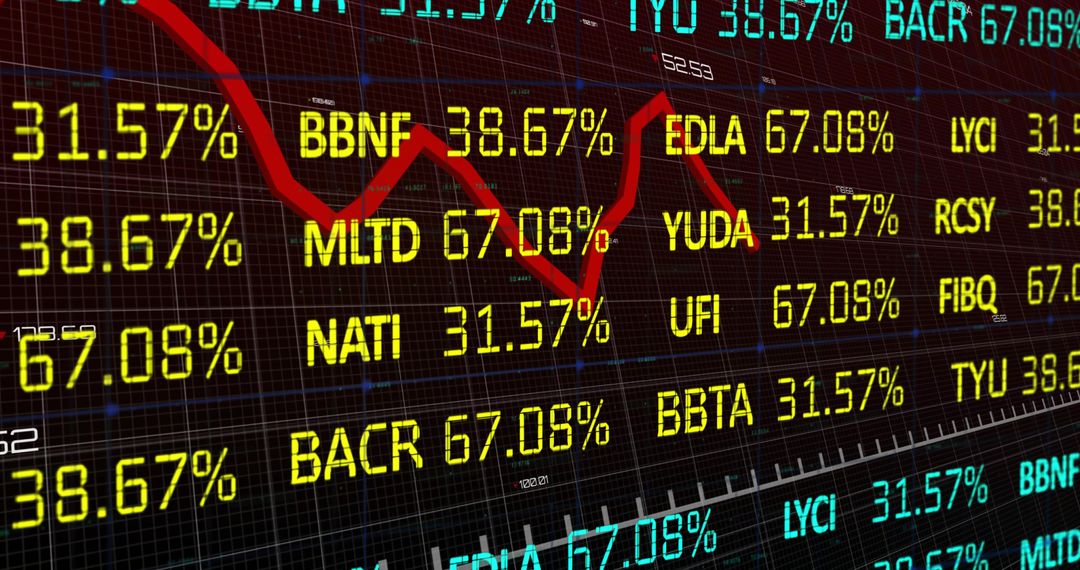
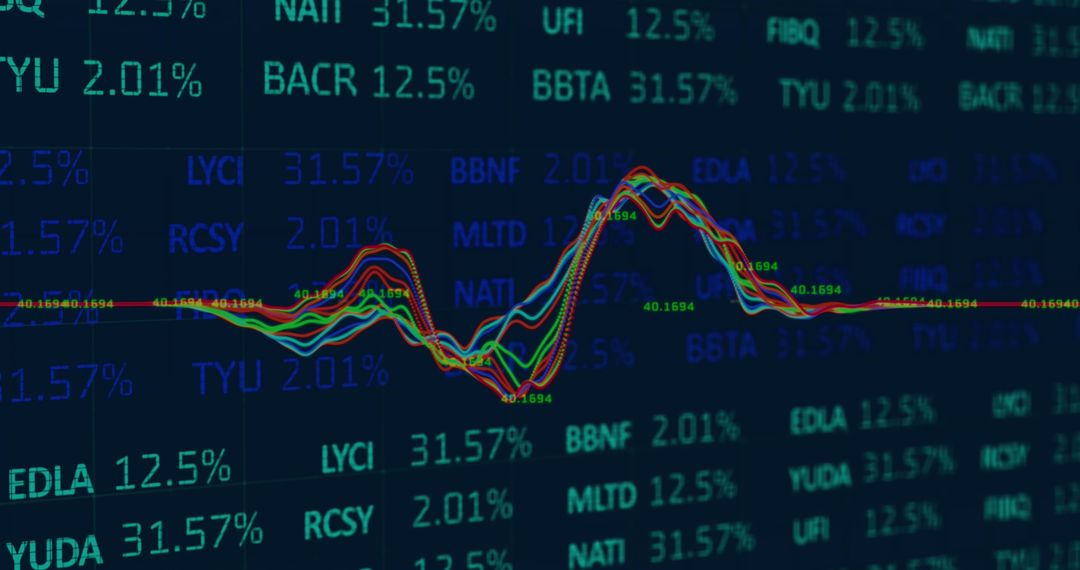
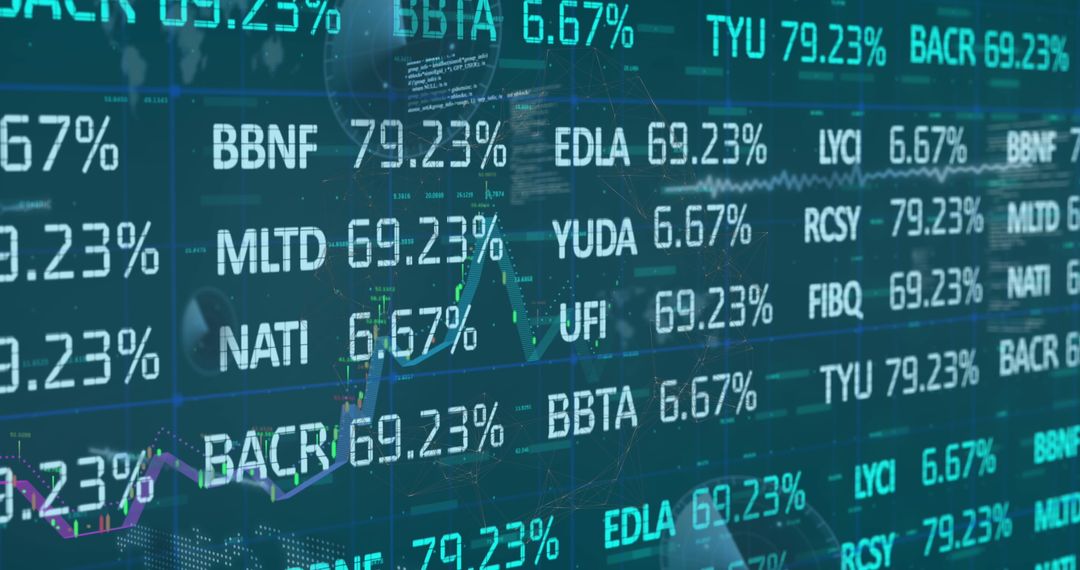
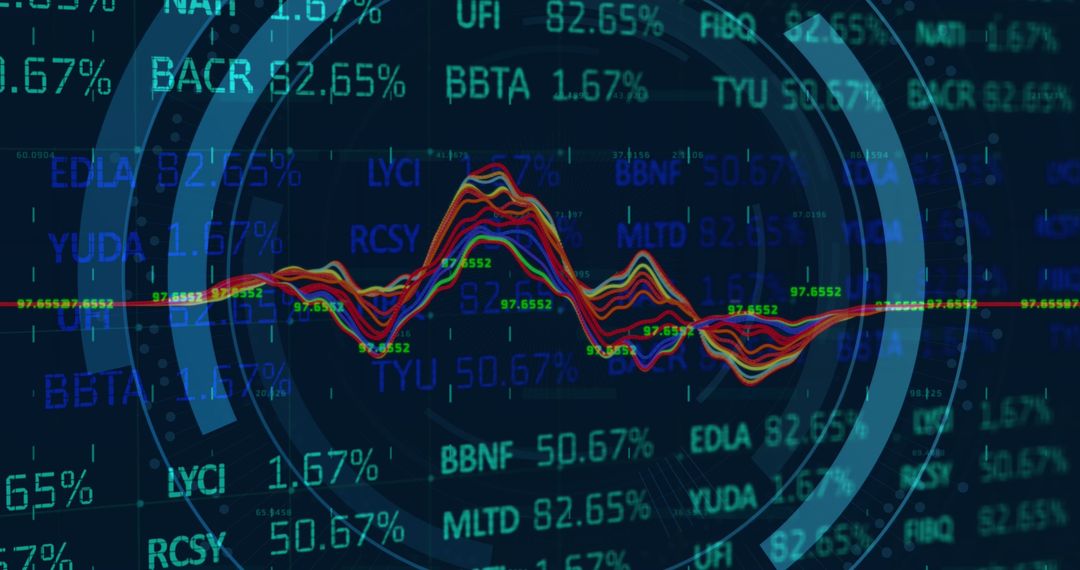
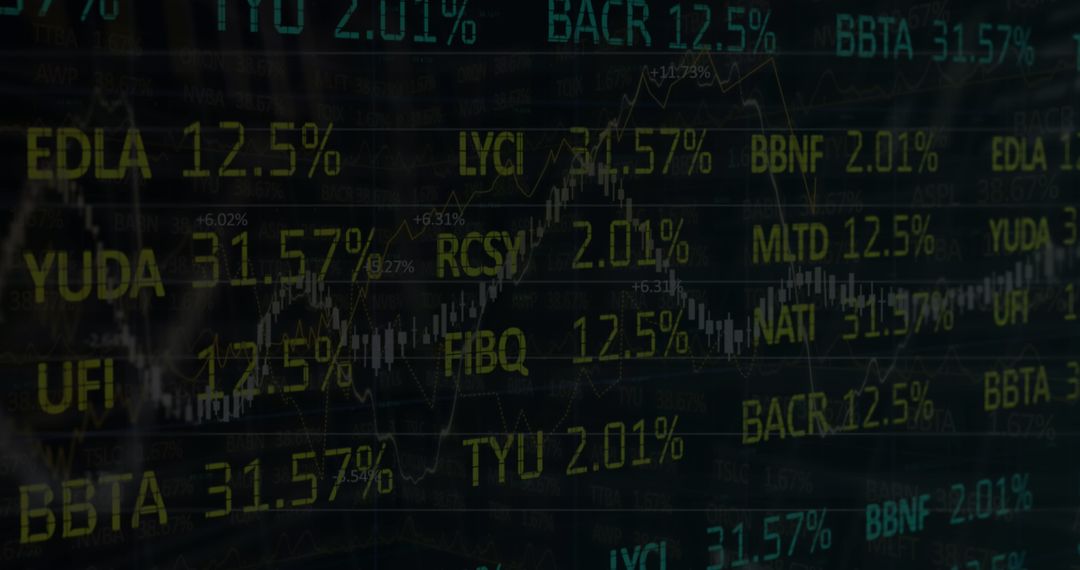
Digital concept portrays global financial connectivity, emphasizing data processing and market trends. Ideal for use in business presentations, articles on stock trading, and teaching materials on economics that explore concepts online stock exchanges, trading analytics, investment strategy, and technological aspects of economic growth.
Powered by 


2
downloads
downloads
Tags:
More
Credit Photo
If you would like to credit the Photo, here are some ways you can do so
Text Link
photo Link
<span class="text-link">
<span>
<a target="_blank" href=https://pikwizard.com/photo/financial-market-data-with-global-connectivity/68378a9dae16fd0311e3488cf35e1238/>PikWizard</a>
</span>
</span>
<span class="image-link">
<span
style="margin: 0 0 20px 0; display: inline-block; vertical-align: middle; width: 100%;"
>
<a
target="_blank"
href="https://pikwizard.com/photo/financial-market-data-with-global-connectivity/68378a9dae16fd0311e3488cf35e1238/"
style="text-decoration: none; font-size: 10px; margin: 0;"
>
<img src="https://pikwizard.com/pw/medium/68378a9dae16fd0311e3488cf35e1238.jpg" style="margin: 0; width: 100%;" alt="" />
<p style="font-size: 12px; margin: 0;">PikWizard</p>
</a>
</span>
</span>
Free (free of charge)
Free for personal and commercial use.
Author: Creative Art
Similar Free Stock Images

Premium


Premium


Premium


Premium


Premium


Premium


Premium


Premium


Premium


Premium


Premium


Premium


Premium


Premium


Premium


Premium


Premium


Premium


Premium


Premium


Premium


Premium


Premium


Premium