- Home >
- Stock Photos >
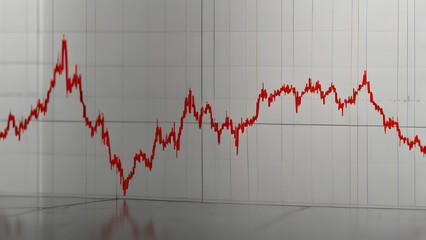
- Financial Market Decline on Digital Screen With Red Line Graph
Financial Market Decline on Digital Screen With Red Line Graph Image

Depicts decreasing stock market trends via a red line on a digital screen displaying complex financial data. Useful for financial reporting articles, market trend analysis materials, or digital presentations discussing stock declines or market volatility.
Powered by 


downloads
Tags:
More
Credit Photo
If you would like to credit the Photo, here are some ways you can do so
Text Link
photo Link
<span class="text-link">
<span>
<a target="_blank" href=https://pikwizard.com/photo/financial-market-decline-on-digital-screen-with-red-line-graph/ad9c57920ae96a16a3c01298387d3d47/>PikWizard</a>
</span>
</span>
<span class="image-link">
<span
style="margin: 0 0 20px 0; display: inline-block; vertical-align: middle; width: 100%;"
>
<a
target="_blank"
href="https://pikwizard.com/photo/financial-market-decline-on-digital-screen-with-red-line-graph/ad9c57920ae96a16a3c01298387d3d47/"
style="text-decoration: none; font-size: 10px; margin: 0;"
>
<img src="https://pikwizard.com/pw/medium/ad9c57920ae96a16a3c01298387d3d47.jpg" style="margin: 0; width: 100%;" alt="" />
<p style="font-size: 12px; margin: 0;">PikWizard</p>
</a>
</span>
</span>
Free (free of charge)
Free for personal and commercial use.
Author: People Creations
Similar Free Stock Images
Loading...

Premium


Premium

Premium


Premium

Premium

Premium


Premium

Premium


Premium


Premium


Premium

Premium

Premium


Premium


Premium


Premium


Premium

Premium


Premium
Premium


Premium


Premium

Premium


Premium


Premium