- Home >
- Stock Photos >
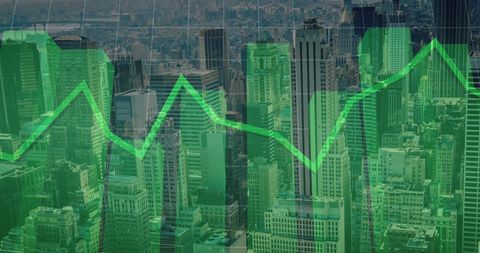
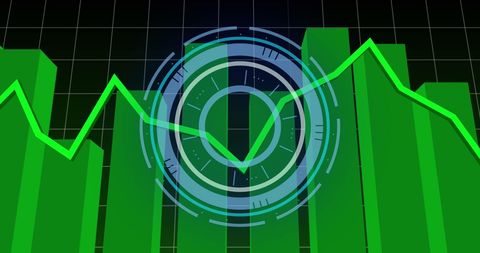
- Financial Market Trends with Green Bar Graph and Fluctuating Line
Financial Market Trends with Green Bar Graph and Fluctuating Line Image

Depicts fluctuations in financial markets through bar graph and line chart. Perfect for illustrating business analysis, economic growth, or financial crisis discussions in presentations, reports, or articles.
Powered by 


0
downloads
downloads
Tags:
More
Credit Photo
If you would like to credit the Photo, here are some ways you can do so
Text Link
photo Link
<span class="text-link">
<span>
<a target="_blank" href=https://pikwizard.com/photo/financial-market-trends-with-green-bar-graph-and-fluctuating-line/08bde761e6c50a304ca6a273579f582d/>PikWizard</a>
</span>
</span>
<span class="image-link">
<span
style="margin: 0 0 20px 0; display: inline-block; vertical-align: middle; width: 100%;"
>
<a
target="_blank"
href="https://pikwizard.com/photo/financial-market-trends-with-green-bar-graph-and-fluctuating-line/08bde761e6c50a304ca6a273579f582d/"
style="text-decoration: none; font-size: 10px; margin: 0;"
>
<img src="https://pikwizard.com/pw/medium/08bde761e6c50a304ca6a273579f582d.jpg" style="margin: 0; width: 100%;" alt="" />
<p style="font-size: 12px; margin: 0;">PikWizard</p>
</a>
</span>
</span>
Free (free of charge)
Free for personal and commercial use.
Author: Authentic Images
Similar Free Stock Images
Loading...

Premium


Premium


Premium
Premium

Premium


Premium


Premium


Premium

Premium

Premium


Premium

Premium


Premium

Premium


Premium


Premium

Premium


Premium


Premium


Premium


Premium


Premium


Premium

Premium


Premium