
- Home >
- Stock Photos >
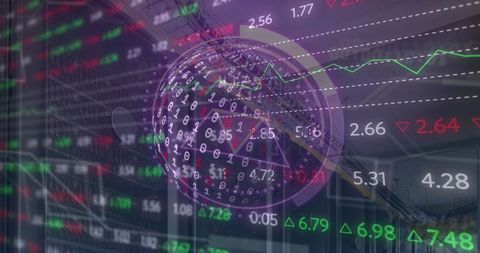
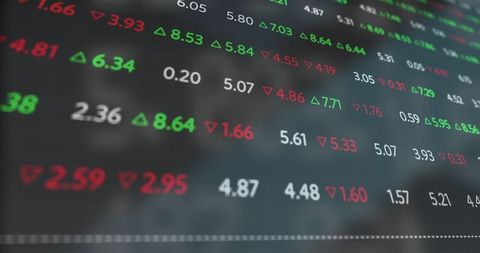
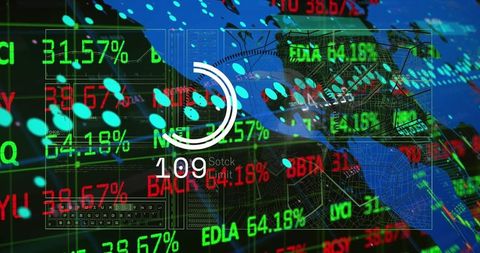
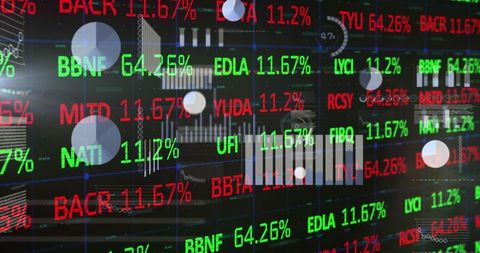
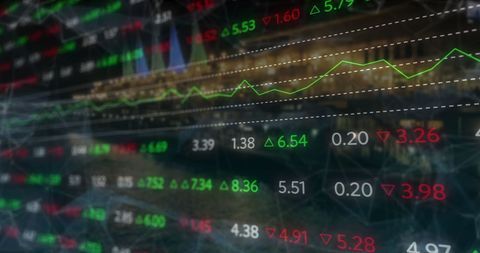
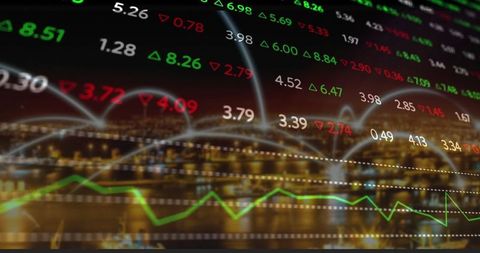
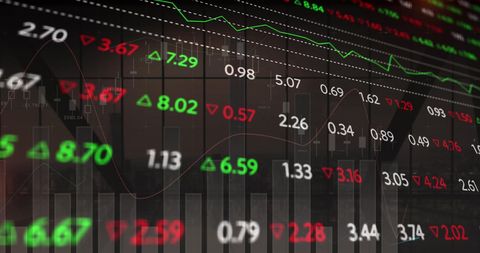
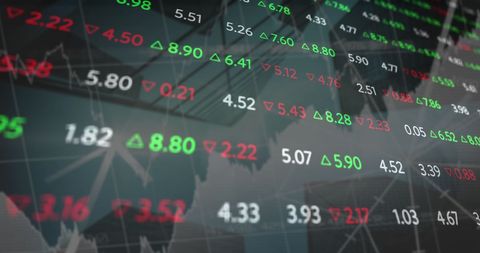
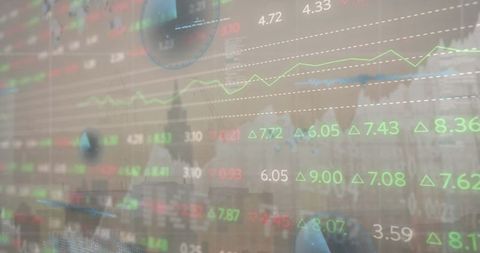
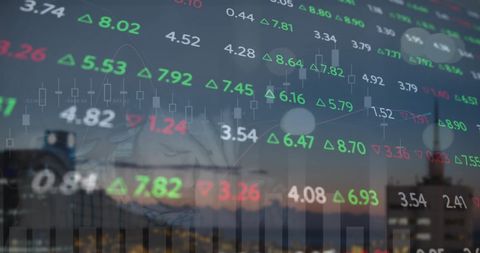
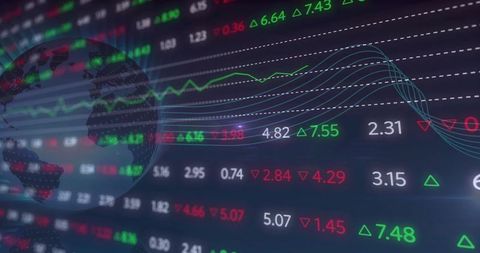
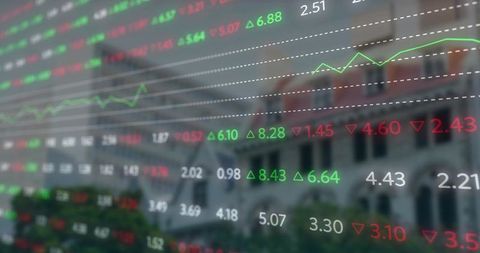
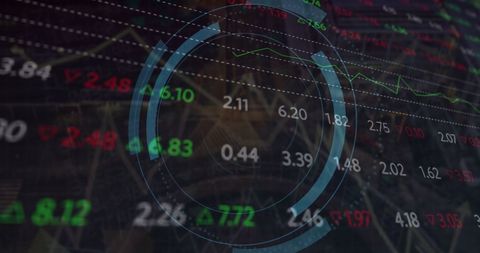
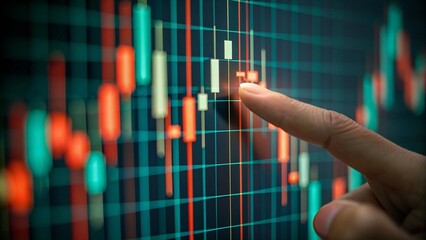
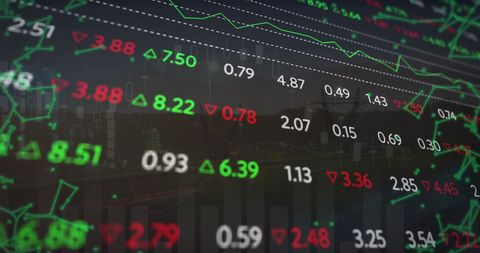
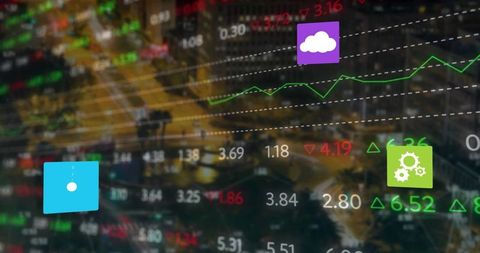
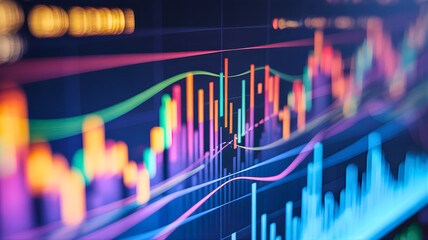
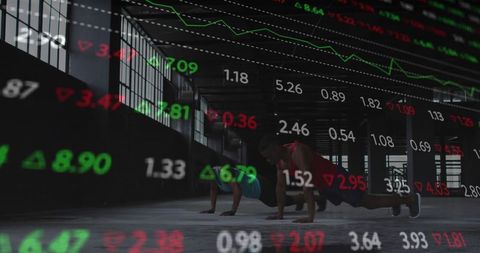
- Financial Network Dashboard with Market Data Visualization
Financial Network Dashboard with Market Data Visualization Image
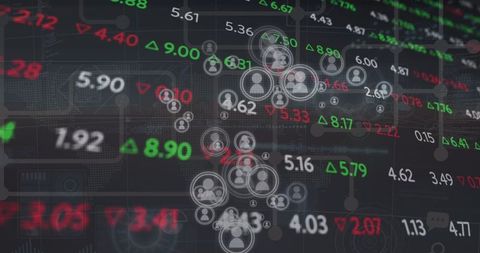
Abstract representation of financial networking on a digital dashboard displaying market tickers and user participation symbols. Red and green numbers indicate market fluctuations, embodying the volatile financial environment visualized through modern technology. Can be used for articles on financial market analysis, economic trends, digital finance technology, and cybersecurity.
Powered by 


downloads
Tags:
More
Credit Photo
If you would like to credit the Photo, here are some ways you can do so
Text Link
photo Link
<span class="text-link">
<span>
<a target="_blank" href=https://pikwizard.com/photo/financial-network-dashboard-with-market-data-visualization/5c3c4f2255e1db7e46ec6336a5805c2d/>PikWizard</a>
</span>
</span>
<span class="image-link">
<span
style="margin: 0 0 20px 0; display: inline-block; vertical-align: middle; width: 100%;"
>
<a
target="_blank"
href="https://pikwizard.com/photo/financial-network-dashboard-with-market-data-visualization/5c3c4f2255e1db7e46ec6336a5805c2d/"
style="text-decoration: none; font-size: 10px; margin: 0;"
>
<img src="https://pikwizard.com/pw/medium/5c3c4f2255e1db7e46ec6336a5805c2d.jpg" style="margin: 0; width: 100%;" alt="" />
<p style="font-size: 12px; margin: 0;">PikWizard</p>
</a>
</span>
</span>
Free (free of charge)
Free for personal and commercial use.
Author: Awesome Content
Similar Free Stock Images

Premium

Premium

Premium


Premium


Premium

Premium


Premium

Premium

Premium

Premium

Premium


Premium


Premium


Premium


Premium


Premium

Premium
Premium

Premium


Premium


Premium

Premium

Premium


Premium

Premium


Explore More Free Stock Images